Dose-Response Relationship
| Home | | Pharmacology |Chapter: Essential pharmacology : Pharmacodynamics Mechanism Of Drug Action; Receptor Pharmacology
When a drug is administered systemically, the doseresponse relationship has two components:
DOSE-RESPONSE RELATIONSHIP
When
a drug is administered systemically, the doseresponse relationship has two
components:
doseplasma concentration relationship and plasma concentrationresponse relationship.
The former is determined by pharmacokinetic
considerations and ordinarily, descriptions of doseresponse relationship refer
to the latter, which can be more easily studied in vitro.
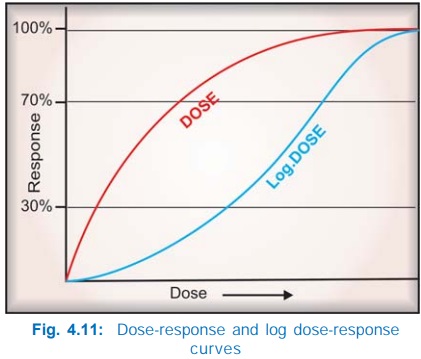
Generally, the
intensity of response increases with increase in dose (or more precisely concentration
at the receptor) and the doseresponse curve is a rectangular hyperbola (Fig.
4.11). This is because drugreceptor interaction obeys law of mass action,
accordingly—
Emax × [D]
E = ————— ...(3)
KD + [D]
Where E is the
observed effect at a dose [D] of the drug, Emax
is the maximal response, KD
is the dissociation constant of the drugreceptor complex, which is equal to the
dose of the drug at which half maximal response is produced. If the dose is
plotted on a logarithmic scale, the curve becomes sigmoid and a linear
relationship between log of dose and the response is seen in the intermediate
(30–70% response) zone, as can be predicted from equation (3). This is not
peculiar to drugs. In fact all stimuli are graded biologically by the
fractional change in stimulus intensity, e.g. 1 kg and 2 kg weights held in two
hands can be easily differentiated, but not 10 kg and 11 kg weights. Though the
absolute difference remains 1kg, there is a 100% fractional change in the former
case but only 10% change in the latter case. In other words, response is proportional
to an exponential function (log) of the dose.
Other advantages of
plotting log doseresponse curves (DRC) are:
i) A
wide range of drug doses can be easily displayed on a graph.
ii) Comparison between
agonists and study of antagonists becomes easier.
Therapeutic Window Phenomenon
This is an unusual
feature seen with certain drugs: optimal therapeutic effect is exerted only
over a narrow range of plasma drug concentrations or drug doses; both below and
above this range, beneficial effects are suboptimal, i.e., the effect declines
if the doses are increased beyond a certain level. Examples are:
§ Tricyclics (imipramine
etc.) exert maximal antidepressant effect when their plasma concentration is
maintained between 50–150 ng/ml.
§ Clonidine lowers BP over
a plasma concentration range of 0.2–2.0 ng/ml; BP may rise at concentrations
above 2 ng/ml.
§ Glipizide exerts
poorer glycaemia control at doses > 25 mg/day.
The pharmacological
basis of this phenomenon is not well understood, but may be due to dual or
complex actions of the drug—different facets of which become prominent at
different concentrations.
The log doseresponse
curve (DRC) can be characterized by its shape (slope and maxima) and position
on the dose axis.
Drug Potency And Efficacy
The
position of DRC on the dose axis is the index of drug potency which refers to the amount of drug needed to produce a
certain response. A DRC positioned rightward indicates lower potency (Fig.
4.12). Relative potency is often more meaningful than absolute potency, and is
generally defined by comparing the dose (concentration) of the two agonists at
which they elicit half maximal response (EC50). Thus, if 10 mg of
morphine = 100 mg of pethidine as analgesic, morphine is 10 times more potent
than pethidine. However, a higher potency, in itself, does not confer clinical
superiority unless the potency for therapeutic effect is selectively increased
over potency for adverse effect.
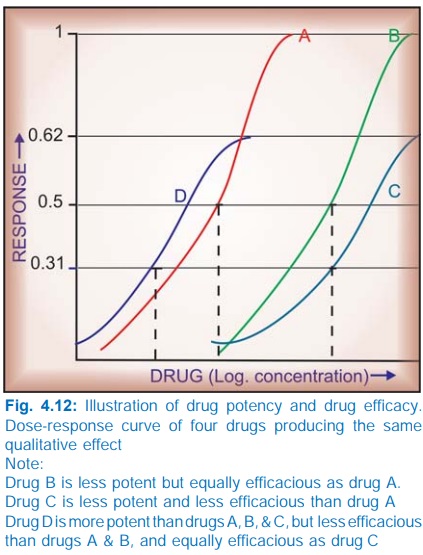
The upper limit of DRC
is the index of drug efficacy and refers to the maximal
response that can be elicited by the
drug, e.g. morphine produces a degree of analgesia not obtainable with any dose
of aspirin—morphine is more efficacious than aspirin. Efficacy is a more
decisive factor in the choice of a drug.
Often
the terms ‘drug potency’ and ‘drug efficacy’ are used interchangeably, but
these are not synonymous and refer to different characteristics of the drug. The
two can vary independently:
§ Aspirin is less potent
as well as less efficacious analgesic than morphine.
§ Pethidine is less
potent but equally efficacious analgesic as morphine.
§ Furosemide is less
potent but more efficacious diuretic than metolazone.
§ Diazepam is more
potent but less efficacious CNS depressant than pentobarbitone.
Depending on the type of drug, both higher
efficacy (as in the case of furosemide confering utility in renal failure) or
lower efficacy (as in the case of diazepam confering safety in overdose) could
be clinically advantageous.
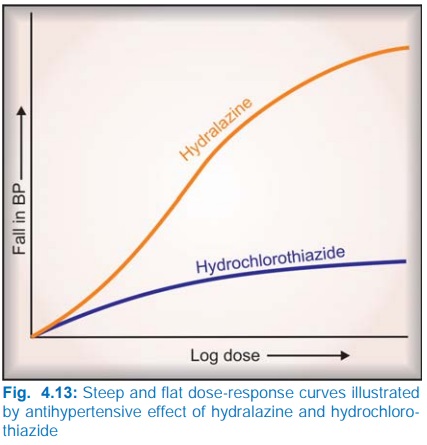
The slope of the DRC is also important. A
steep slope indicates that a moderate increase in dose will markedly increase
the response (dose needs individualization), while a flat one implies that
little increase in response will occur over a wide dose range (standard doses
can be given to most patients). Hydralazine has a steep, while hydrochlorothiazide
has a flat DRC of antihypertensive effect (Fig. 4.13).
Selectivity
Drugs seldom produce just one action: the DRCs
for different effects of a drug may be different. The extent of separation of
DRCs of a drug for different effects is a measure of its selectivity, e.g. the
DRCs for bronchodilatation and cardiac stimulation (Fig. 4.14) are quite
similar in case of isoprenaline, but far apart in case of salbutamol—the latter
is a more selective drug.
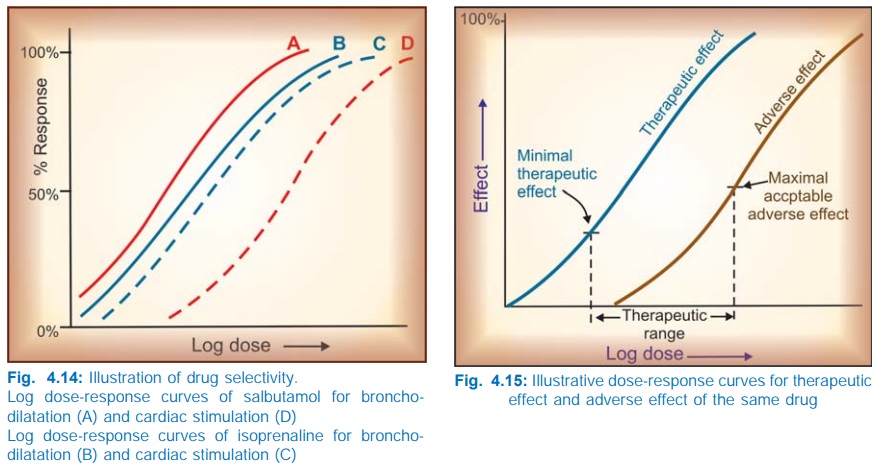
The gap between the therapeutic effect DRC and
the adverse effect DRC defines the safety
margin or the therapeutic index of a drug. In experimental animals, therapeutic
index is often calculated as:
median
lethal dose
Therapeutic index =
—————————–
median effective dose
LD50
or ——–
ED50
But this is irrelevant
in the clinical set up where the therapeutic
range is bounded by the dose which produces minimal therapeutic effect and
the dose which produces maximal acceptable adverse effect (Fig. 4.15). Because
of individual variability, the effective dose for some subjects may be toxic
for others; defining the therapeutic range for many drugs is a challenging
task. A drug may be capable of inducing a higher therapeutic response (have
higher efficacy) but development of intolerable adverse effects may preclude
use of higher doses, e.g. prednisolone in bronchial asthma.
Risk-Benefit Ratio
This term is very
frequently used, and conveys a
judgement on the estimated harm (adverse effects, cost, inconvenience) vs expected advantages (relief of
symptoms, cure, reduction of complications/mortality, improvement in quality of
life). A drug should be prescribed only when the benefits outweigh the risks.
However, riskbenefit ratio can hardly ever be accurately measured for each
instance of drug use, because ‘risk’ is the probability of harm; and harm has
to be qualified by its nature, quantum, timecourse (transient to lifelong) as
well as the value that the patient attaches to it. None of these can be
precisely ascertained. As such, the physician has to rely on data from use of
drugs in large populations (pharmacoepidemiology) and his own experience of the
drug and the patient.
Related Topics
