Functions of the Heart
| Home | | Anatomy and Physiology | | Anatomy and Physiology Health Education (APHE) |Chapter: Anatomy and Physiology for Health Professionals: The Heart
Both sides of the heart contract at the same time, and eject equal volumes of blood. However, pressure is lower in the right atrium and ventricle than in the left atrium and ventricle. In atrial systole, the cardiac cycle begins. In a resting adult, this lasts for about 100 ms.
Functions
of the Heart
Both sides of the heart contract at the same time, and eject
equal volumes of blood. However, pressure is lower in the right atrium and
ventricle than in the left atrium and ventricle. In atrial systole, the cardiac cycle begins. In a resting adult, this
lasts for about 100 ms.
Atrial Systole
There are three steps to atrial systole, as follows:
■■ As the atria contract, rising
pressure pushes blood into the ventricles, through the right and left
atrioventricular (AV) valves.
■■ As atrial systole begins, the
ventricles are filled to about 70% of their capacity, because of passive blood
flow at the end of the previous cardiac cycle. The atria contract, and
increasing atrial pressure provides the other 30%, pushing blood through the AV
valves. Therefore, atrial systole basically “fills up” the ventricles to 100%.
■■ As atrial systole ends, the ventricles
contain the maximum amount of blood they will hold in this cardiac cycle, which
is known as the end-diastolic
volume or EDV. This
volume is about 130 ml, or 4.4 ounces, in a resting adult who is standing.
Ventricular Systole
Ventricular systole begins after atrial systole, and lasts
about 270 ms in an adult who is resting. Pressures in the ventricles rise to
become greater than the atrial pressures, and the AV valves are forced to
close. There are also three steps to ventricular systole:
■■ Early in ventricular systole, the
ventricles con-tract but blood flow has not occurred. The pressures care not
yet enough to force the semilunar valves to open, or to push blood into the
pulmo-nary or aortic trunks. At this time, the ventricles contract
isometrically, generating tension and increased pressure, yet blood does not
flow out. This is called isovolumetric
contraction, in which
all heart valves are closed. The ventricular volume does not change, but
ventricular pres-sure is increasing.
■■ When ventricular pressure exceeds
the pressure in the arterial trunks, the semilunar valves open. Blood flows
into the pulmonary and aortic trunks, which is the beginning of ventricular ejection. The
ventricles then contract isotonically, mean-ing their muscle cells shorten and
there is a near constant production of tension. When a peak is reached,
ventricular pressure gradually reduces, near the end of ventricular systole.
The right ven-tricle also experiences isovolumetric contraction and ventricular
ejection, yet pressure in the right ventricle and pulmonary trunk are
significantly lower. The amount of blood ejected by each ven-tricle during
contraction, 70 to 80 mL of blood, is the stroke volume of the heart. At rest, this is
about 60% of the end-diastolic volume. This percentage is called the ejection fraction, and is varied based
on the different demands placed on the heart.
■■As ventricular systole
is ending, pressures inthe ventricles quickly fall. Blood in the aorta and
pulmonary trunk begin to flow back to the ventricles, closing the semilunar
valves. When backflow starts, pressure reduces in the aorta.Once the semilunar valves
are closed, pressure increases again, and the elastic walls of the arteries
recoil. This short pressure increase causes a “valley” in the pressure tracing,
known as a dicrotic notch. Blood remaining in the ventricle when its semilunar
valve closes is called the end-systolic volume or ESV. At rest, this volume is
50 mL, which is about 40% of the end-diastolic volume.
Ventricular Diastole
Ventricular diastole lasts for
about 430 ms in the cur-rent cardiac cycle, yet continues through atrial
systole in the next cycle. There are two steps in ventricular diastole:
■■ During this period, all heart
valves are closed, and the myocardium is relaxing. Ventricular pressures are
still higher than that of the atria, and blood can-not flow into the
ventricles. This is called isovol-umetric
relaxation. Pressure in the ventriclesdrops quickly since
elasticity of the heart’s connec-tive tissue and cardiac skeleton help the
ventricles to re-expand toward resting dimensions.
■■ When ventricular pressures reduce to below atrial
pressures, the AV valves are forced open. Blood flows from the atria into the
ventricles, meaning that all these chambers are in diastole. However,
ventricular pressures continually reduce as the ventricles expand. Pressures in
the ventricles are so much less than the pressure in the major veins that blood
moves quickly through the relaxed atria, through the AV valves, and into the
ventricles. This is a passive mechanism, and is the main method of ventricular
filling. Before the cardiac cycle ends, the ventricles become almost 75% full.
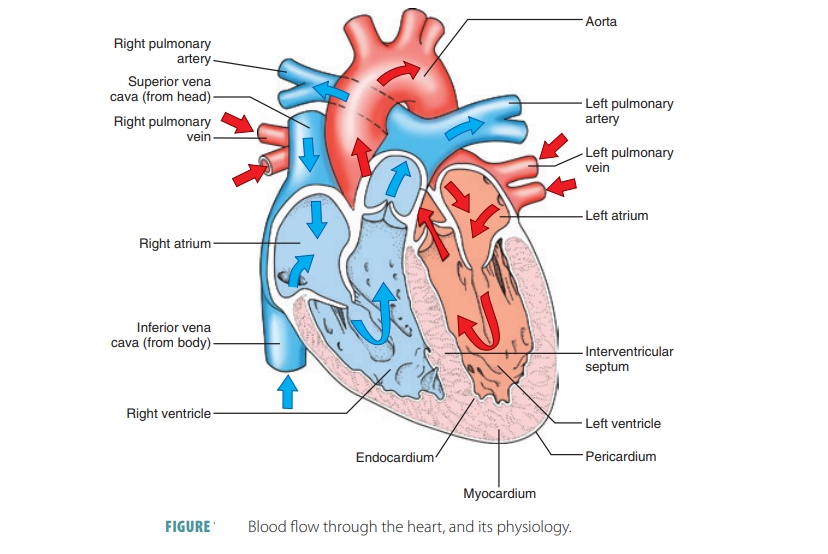
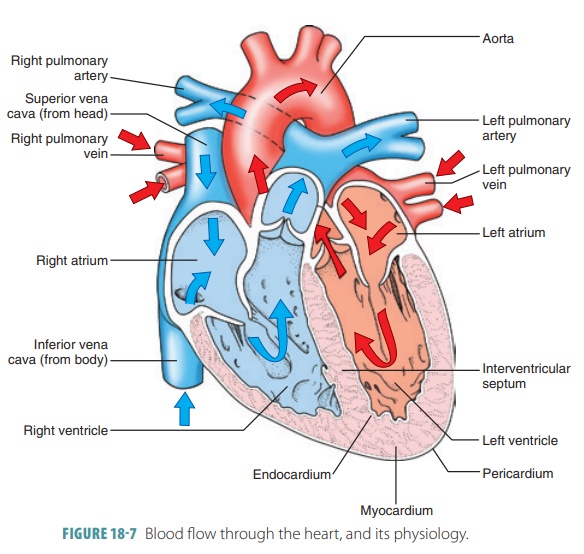
Overall, atrial systole does not contribute greatly to
ventricular volume. This means that people with severe atrial damage often
survive. However, dam-age to one or both ventricles, can cause the heart to be
unable to pump blood through the peripheral organs and tissues. This is the
condition known as heart
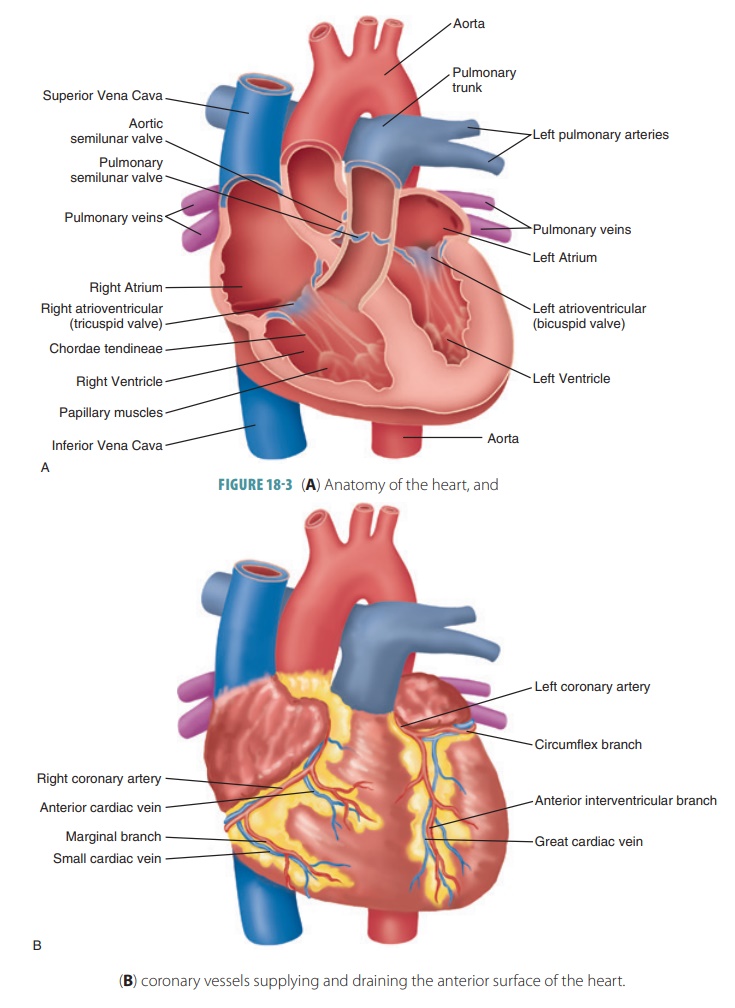
failure. Blood flow through the heart and itsphysiology
are shown in FIGURE
18-7.
1. Conduction System
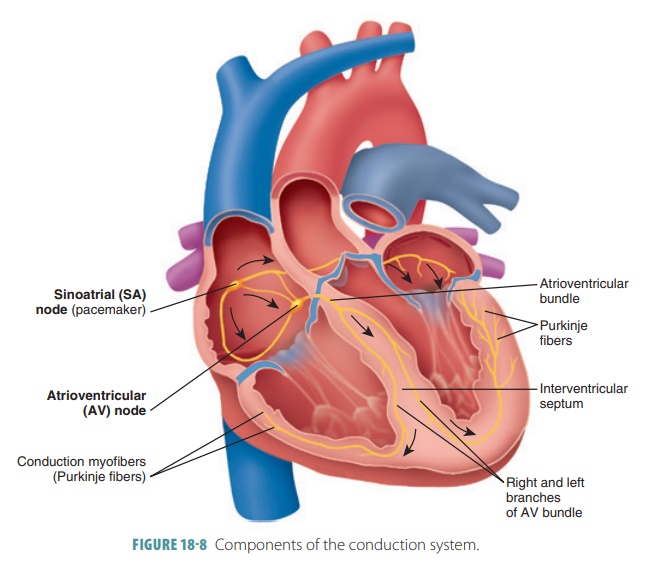
Strands and clumps of specialized cardiac muscle con-tain
only a few myofibrils and are located throughout the heart. These areas
initiate and distribute impulses through the myocardium, comprising the cardiacconduction system, which coordinates the
cardiaccycle (FIGURE
18-8). This system is also known as the conducting system or nodal system and includes the
sinoatrial (S-A) node, atrioventricular (A-V) node, and conducting cells, which are found in intermodalpathways that distribute
contractile stimuli to atrialmuscle cells.
Depolarization and contraction of cardiac muscle are
intrinsic and do not depend on the nervous system. The heart can continue to
beat in rhythm even when all nerve connections are severed. However, a normal
healthy heart has many autonomic nerve fibers able to alter its rhythm.
Noncontractile cardiac cells are specialized to initiate and then distribute
impulses in the heart, keeping its depolarization and contraction orderly and
in sequence.
A stable resting membrane potential is main-tained in
uninsulated contractile cardiac cells. How-ever, the cardiac pacemaker cells have an unstable resting potential. These autorhythmic cells continu-ously
depolarize and move slowly toward threshold. Their spontaneously changing
membrane potentials are called prepotentials,
or pacemaker potentials. These
potentials initiate action potentials, which spread through the heart and
trigger contractions.
In pacemaker cells, the three parts of an action potential are pacemaker potential, depolarization, and repolarization. Cardiac pacemaker cells exist in the S-A node, A-V node, atrioventricular (A-V) bundle, right and left bundle branches, and Purkinje fibers. Impulses pass across the heart in this order, beginning with the S-A node and ending with the Purkinje fibers.
S-A Node
The sinoatrial
node (S-A node) is a small crescent-shaped mass of specialized tissue just
beneath the epicardium, in the right atrium. It is located near the opening of
the superior vena cava, with fibers
continu-ous with those of the atrial syncytium. The S-A node’s cells can reach
threshold on their own, initiating impulses through the myocardium, stimulating
con-traction of cardiac muscle fibers. Its rhythmic activity occurs 70 to 80
times per minute in a normal adult. Because it generates the heart’s rhythmic
contractions, it is often referred to as the pacemaker. No other part of the conduction system has a faster
depolarization rate than the S-A node. The path of a cardiac impulse travels
from the S-A node into the atrial syncytium. The atria begin to contract almost
simultaneously. The characteristic rhythm of the S-A node is called the sinus rhythm, which determines heart
rate.
A-V Node
The impulse passes along junctional fibers of the conduction
system to a mass of specialized tissue called the atrioventricular node (A-V node), located
in the inferior interatrial septum,
beneath the endocardium. The A-V node
provides the only normal conduction pathway between the atrial and ventricular
syncytia. Impulses are slightly delayed for 0.1 second because of the small
diameter of the junctional fibers. The atria therefore have more time to
contract and empty all their blood into the ventri-cles before ventricular
contraction occurs. Impulse conduction is slower in the A-V node than in other
parts of the conduction system. Damage to the A-V node is referred to as heart
block.
A-V Bundle
When the cardiac impulse reaches the distal A-V node, it
passes into a large A-V
bundle, or bundle ofHis,
entering the upper part of the
interventricular septum . The atria and ventricles are not connectedby gap
junctions even though they meet each other. The only electrical connection
between them is the A-V bundle.
Right and Left Bundle Branches
The A-V bundle soon splits into the right and left bun-dle branches. These branches move along the
interven-tricular septum toward the apex of the heart.
Purkinje Fibers
Nearly halfway down the septum, the right and left bundle
branches spread into enlarged Purkinjefibers,
extending into the papillary muscles. Thefibers consist of long strands of
barrel-shaped cells with only a few myofibrils, which continue to the heart’s
apex, curving around the ventricles and pass-ing over their lateral walls. They
complete the pathway through the interventricular septum. The Purkinje fibers
have numerous small branches that become continuous with cardiac muscle fibers
and irregular whorls. Superiorly, the Purkinje fibers turn into the ventricular
walls. Purkinje fiber stimulation causes the ventricular walls to contract in a
twisting motion to force blood into the aorta and pulmonary trunk. The Purkinje
fibers are also referred to as the subendocar-dial
conducting network.
1. Explain the major differences between cardiac and skeletal
muscle fibers.
2. Describe aerobic respiration and its effects on the heart.
3. Identify the locations of cardiac pacemaker cells.
4. Why is it important for impulses from the atria to be
delayed at the A-V node before they pass into the ventricles?
Electrocardiogram
An electrocardiogram
(ECG) is used to record electri-cal changes in the myocardium
during the cardiac cycle, using a machine known as an electrocardiograph. An ECG provides information about
coronary circula-tion. As action potentials stimulate cardiac muscle fiber
contraction, a specific pattern appears—it is not the same as individual action
potentials. Because body flu-ids conduct electrical currents, these electrical
changes can be detected on the body’s surface. Nodes are placed on the skin and
connected by wires to the electrocar-diograph. Typically, 12 leads or electrodes are used that respond to weak
electrical changes by moving a pen or stylus on a moving strip of paper. The
movements cor-respond to myocardial electrical changes. The regular movement of
the paper allows the distance between the pen movements to record the time
between phases of the cardiac cycle.
Three of the electrodes are bipolar leads. They measure
voltage differences between both arms or between one arm and one leg. Nine of
the electrodes are unipolar leads. The total of 12 leads provides a complete
picture of the electrical activity of the heart.
A normal electrocardiographic pattern includes several waves
or deflections during each cardiac
cycle. In between, muscle fibers remain polarized, and the pen does not move
except for indicating the baseline reading (FIGURE 18-9). As the S-A node triggers an impulse, the atrial fibers
depolarize to produce a recordable electrical change. The first pen movement
produces a P wave that shows the depolarization of the atrial fibers leading to
atrial contraction. The P wave lasts about 0.08 seconds.
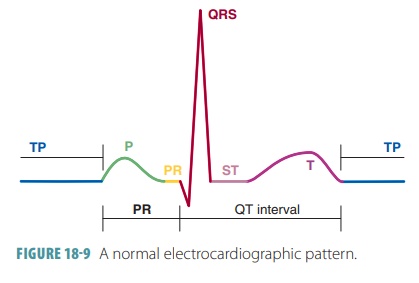
As the impulse reaches ventricular fibers, they quickly
depolarize, showing a greater electrical change because of the thicker
ventricular walls. When the change ends, the resulting mark is called the QRS com-plex, consisting of a Q, R, and
S waves that correspondto the depolarization of ventricular fibers before
ven-tricular contraction. The QRS complex has an intri-cate shape because there
is a constant change in the paths of depolarization waves through the
ventricular walls. The QRS complex also takes about 0.08 seconds.
As the ventricles repolarize, a T wave is pro-duced and recorded.
Atrial repolarization is missing from the pattern because atrial fibers
repolarize at the same time the ventricular fibers are depolarizing. The T wave
lasts about 0.16 seconds. Because repolariza-tion is slower than
depolarization, the T wave appears more spread out, with a lower amplitude
height than the QRS complex. It is often obscured by the larger QRS wave being
recorded simultaneously.
Electrocardiographic patterns are used to assess the heart’s
conduction of impulses. The P-Q interval is the time period between the P wave
and the QRS complex and can indicate impulse transmission times between the S-A
node and A-V node to indicate isch-emia or other conditions that affect the A-V
conduc-tion pathways. Damage to the A-V bundle can extend the QRS complex,
showing a different recording on an ECG. The P-Q interval takes about 0.16
seconds and is also referred to as the P-R interval if the Q portion is not
visible. The P-R interval includes atrial depolariza-tion, contraction, and the
passage of the depolarization wave through the remainder of the conduction
system.
The S-T segment occurs when the action poten-tials of the
ventricular myocytes are in their plateau phases. At this tie, all the
ventricular myocardium is depolarized. The Q-T interval lasts about 0.38 seconds.
It is the period from the start of ventricular depolar-ization through
ventricular repolarization.
Speed of Conduction
From the time the S-A node generates an impulse until
depolarization of the final ventricular muscle cells takes only 220 ms in a
healthy heart. After the ventricular depolarization wave, ventricular
contrac-tion is nearly immediate. The motion of contraction starts at the heart
apex, moves toward the atria, and follows the excitation wave’s direction
through the ventricle walls. Some contained blood is ejected supe-riorly into
the large arteries that leave the ventricles.
Various speeds of spontaneous depolarization also exist. The
heart normally beats 75 times per minute because of the actions of the S-A
node. If the S-A node was not there, the A-V node would depolarize
approximately 50 times per minute. If the A-V node was not providing input, the
A-V bundle and remain-der of the conduction system would depolarize only
approximately 30 times per minute, even though their conduction speed is
extremely rapid.
Without the conduction system, cardiac impulses would travel
very slowly. Instead of moving several meters per second in most areas, they
would move only 0.3 to 0.5 meters per second. This would reduce the effectiveness
of the heart’s pumping action because it would allow certain muscle fibers to
contract a long time before others.
Parasympathetic and Sympathetic Innervation
When the body requires more blood, such as during exercise,
the heart rate increases to pump more blood to the body. Parasympathetic fibers
that innervate the heart arise from neurons in the medulla oblongata of the
brain. Many of these fibers branch out to the S-A and A-V nodes. Nerve impulses
reach nerve fiber end-ings, secreting acetylcholine, decreasing S-A and A-V
node activity, and decreasing heart rate.
The cardioacceleratory
center of the medulla oblon-gata projects to sympathetic preganglionic
neurons in levels T1 to T5 of the spinal cord. These neurons synapse with
postganglionic neurons located in the cervical and upper thoracic sympathetic
trunk. Post-ganglionic fibers then run through the cardiac plexus to the heart,
innervating the S-A and A-V nodes as well as the heart muscle and coronary
arteries. The cardioinhibitory center sends
impulses to the para-sympathetic dorsal vagus nucleus, also in the medulla
oblongata. This sends inhibitory impulses to the heart via vagus nerve
branches.
Continual parasympathetic fiber activity can increase or
decrease heart rate, working in opposing fashion. Increased parasympathetic
impulses slow down the heart rate while decreased parasympathetic impulses
raise the heart rate. Sympathetic fibers reach the heart structures and nodes,
and their ends secrete norepinephrine in response to nerve impulses that
increase myocardial contraction rates and forces. Basi-cally, the sympathetic
nervous system is described as “accelerating” heart rate, whereas the
parasympathetic nervous system is described as “decelerating” heart rate.
Effects of the sympathetic and parasympathetic nerve fibers
are balanced by baroreceptor reflexes that involve the brain’s cardiac control
center. Sensory impulses are received and relayed between the brain and heart.
Baroreceptors detect changes in blood pres-sure. Cerebral or hypothalamic
impulses also influence the cardiac control center, as do temperature changes
and certain ions.
Ions
The most important ions that influence heart action are
potassium and calcium. Excess extracellular potassium ions or hyperkalemia decrease contraction rates
and forces, whereas deficient extracellular potassium ions or hypokalemia may cause a potentially
life-threatening abnormal heart rhythm or arrhythmia.
Excess extracel-lular calcium ions, a condition called hypercalcemia, can cause the heart to contract for an abnormally
long time, whereas deficient extracellular calcium ions, known as hypocalcemia, depress heart action.
1. Describe how an ECG records electrical heart activities.
2. Define what is occurring during the P-R interval, QRS
complex, and the T wave on an ECG.
3. Contrast the cardioacceleratory and cardioinhibitory
centers.
2. Heart
Sounds
A heartbeat makes a characteristic double thumping sound
when heard through a stethoscope, because of vibrations of the heart tissues
related to the valves closing. The first thumping sound occurs during ventricular
contraction when the A-V valves close and indicates when ventricular pressure
rises above atrial pressure. This is the beginning of ventricular systole. The first sound is usually the
loudest, longest,and most resonant heart sound. The second sound occurs during
ventricular relaxation when the pulmo-nary and aortic or semilunar valves close. This is the beginning of ventricular
relaxation or diastole, and the sound
is shorter and sharper than the first. The two heart sounds are often described
as “lub-dup,” “pause,” “lub-dup,” “pause,” and so on.
The mitral valve closes just before the tricus-pid valve.
Also, the aortic semilunar valve usually closes just before the pulmonary valve.
Auscultating the four specific regions of the thorax distinguishes each
individual valve sound. The four points are not directly superficial to the
valves because the sounds take various paths to reach the chest wall. However,
these points help to define the four corners of a nor-mal heart. By
understanding a normal heart’s location and size, one can more easily recognize
a disease and/ or enlarged heart.
The four points of auscultation used to hear each individual
valve sound are as follows:
■■ Aortic
valve: second intercostal space at the right sternal margin
■■ Pulmonary
valve: second intercostal space at the left sternal margin
■■ Mitral
valve: over the heart apex, in the fifth inter costal space, in line with
the middle of the clavicle
■■ Tricuspid
valve: usually heard in the right sternal margin of the fifth intercostal
space
3. Cardiac
Cycle
One cardiac cycle
causes pressure in the heart cham-bers to rise and fall and valves to open and
close. The sequence of contraction of the heart chambers is both atria,
followed by both ventricles. Early during diastole, pressure in the ventricles
is low, causing the A-V valves to open and the ventricles to fill with blood.
Nearly 70%
of returning blood enters the ventricles before contrac-tion.
As the atria contract, the remaining 30% is pushed into the ventricles. As the
ventricles contract, ventricu-lar pressure rises. When it exceeds atrial
pressure, the A-V valves close and papillary muscles contract, pre-venting the
cusps of the A-V valves from bulging into the atria excessively. During
ventricular contraction, the A-V valves are closed and atrial pressure is low.
Blood flows into the atria while the ventricles are contracting, so the atria
are prepared for the next cardiac cycle.
As ventricular pressure exceeds pulmonary trunk and aorta
pressure, the pulmonary and aortic valves open. Blood is ejected from the
ventricles into these arteries, and ventricular pressure drops. When it is
lower than in the aorta and pulmonary trunk, the semilunar valves close. When
ventricular pressure is lower than atrial pressure, the A-V valves open and the
ventricles begin to refill.
Cardiac muscle fibers are similar in function to skeletal
muscle fibers but are connected in branched networks. If any part of the
network is stimulated, impulses are sent throughout the heart, and it
con-tracts as a single unit. A functional
syncytium is a mass of merging cells that function as a unit. There
are two of these structures in the heart, one in the atrial walls and one in
the ventricular walls. A small area of the right atrial floor is the only part
of the heart’s muscle fibers not separated by the fibrous cardiac skeleton. Here, the atrial syncytium and the ventric-ular syncytium
are connected by cardiac conduction system fibers.
4. Cardiac
Output
Heart action determines the amount of blood enter-ing the
arterial system with each ventricular contrac-tion. Stroke volume is defined as the volume of blood discharged from the
ventricle with each contraction. An average adult male’s stroke volume is
relatively constant, at about 70 mL. The movements and forces that are
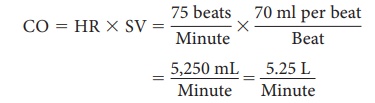
generated during contractions of the heart are referred to as cardiodynamics. The cardiac output is defined as the volume discharged
from the ven-tricle per minute. It is calculated by multiplying the stroke volume by the heart rate, in
beats per minute.So, if the stroke volume is 70 mL and heart rate is 75 beats
per minute, the cardiac output is 5,250 mL per minute. Blood pressure varies
with cardiac output and increases or decreases based on similar changes in
stroke volume or heart rate. If the heart is seriously weakened or blood volume
decreases greatly, stroke volume declines, and cardiac output is maintained by
increasing contractility and heart rate.
The average adult cardiac output is calculated as follows:
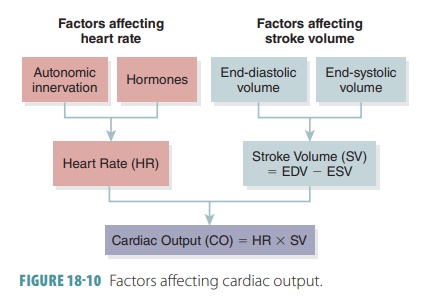
Cardiac output increases when stroke volume increases, when
the heart beats faster, or both. It decreases when one or both of these factors
decrease.
Remember that stroke volume represents the dif-ference
between end-diastolic volume and end-systolic volume. End-diastolic volume is the amount of blood that collects in a
ventricle during diastole. End-systolicvolume
is the amount of blood that remains in a ventri-cle after it has already
contracted. End-diastolic volume is normally 120 mL, and end-systolic volume is
nor-mally 50 mL. Therefore, the difference between them is 120 mL minus 50 mL,
which equals 70 mL. FIGURE
18-10 summarizes the factors affecting cardiac output.
Preload
The three most important things to remember about the regulation of stroke volume are preload, contrac-tility, and afterload. Preload is the degree the heart muscle can stretch just before contraction. It is directly proportional to the end-diastolic volume, and affects how the muscle cells are able to produce tension. When sarcomere length increases past resting length, the force that is produced during systole increases. The amount of preload and degree of myocardial stretch-ing changes with demands placed upon the heart. In ventricular systole, there is little developed power in the cardiac muscle cells. The amount of blood in the ventricle after contraction or end-systolic volume, is relatively high since there is only a short amount of muscle cell contraction.
With exercise, venous return is increased, and there is more
blood flowing into the heart. The end- diastolic volume increases, and there
is more stretch-ing of the myocardium. When the sarcomeres are close to their
optimal lengths, ventricular muscle cells are able to contract better,
producing stronger contractions. They become shorter, and more blood can be
pumped out of the heart. Preload controls stroke volume, and in normal
conditions the higher the preload, the higher the stroke volume. The relationship
between the preload and stroke volume is called the Frank-Starling lawof
the heart . Resting cardiac cells are usually shorter than their
optimal length, so stretching can cause significant increases in contractile
force. The most important factor concerning preload is venous return, which is the amount of blood returning to the heart
and distend-ing its ventricles. The atrial
reflex or Bainbridge reflex
concerns adjustments made to heart rate as a response to increases in venous
return.
Contractility
Contractility
is
the contractile strength achieved at acertain muscle length. Extrinsic factors
increasing contractility of the heart muscle can also enhance stroke volume.
Greater contractility results in more blood being ejected from the heart, which
increases stroke volume and lowers end-systolic volume. Con-tractility is
increased when sympathetic stimulation is increased. Various substances also
affect contrac-tility. Positive inotropic
agents are substances that increase contractility and include epinephrine,
glucagon, thyroxine, digitalis, and extracellular calcium ions. Negative inotropic agents decrease
contractil-ity and include excessive hydrogen ions, increased extracellular
potassium levels, and calcium channel blockers.
Afterload
Afterload
is the back-pressure exerted by the arterialblood on the aortic
and pulmonary valves. The ventri-cles must overcome this pressure to eject
blood. This pressure is about 80 mm Hg in the aorta and about 10 mm Hg in the
pulmonary trunk. When a person is healthy, afterload is relatively constant,
but in hyper-tensive people, afterload reduces the ventricles’ ability to eject
blood. As a result, the heart retains more blood after systole, which increases
end-systolic volume and decreases stroke volume.
Cardiac
reserve is the difference between theresting and maximal cardiac
output. It is usually four to five times the resting cardiac output in a
nonathletic person. This resting output is 20 to 25 litersper minute.
However, in a trained athlete, cardiac output may reach seven times the resting
cardiac output, which is 35 liters per minute.
5. Regulation of Heart Rate
Stroke volume is fairly consistent in a healthy heart and
cardiovascular system. Regulation of heart rate includes homeostatic mechanisms
such as autonomic, chemical, hormonal, and other forms of regulation.
Autonomic Tone
The heart, like other organs that have dual innerva-tion,
has a resting autonomic tone. Both divisions of the ANS are usually active at a
steady pace. Ace-tylcholine and norepinephrine are released at the nodes, and
into the .myocardium. Because of this, if the vagus nerves are cut, the heart
rate increases. Sympathetic blocking agents (such as beta-blockers) decrease
heart rate. When a healthy person is at rest, parasympathetic effects dominate.
When there is no autonomic innervation, the heart rate is established by the
pacemaker cells of the SA node. The heart then beats between 80 and 100 times
per minute. However, an average adult heart at rest, with normal innerva-tion,
beats between 70 and 80 times per minute. This is because of activity in the
parasympathetic nerves that innervate the SA node. The heart rate becomes even
slower if parasympathetic activity increases. Oppositely, heart rate increases
when parasympa-thetic activity decreases, or when sympathetic acti-vation
occurs. The ANS uses dual innervation and autonomic tone adjustments to
delicately adjust car-diovascular function, meeting the demands of other body
systems.
When the right atrial walls stretch, the stretch receptors
trigger a reflexive increase in the heart rate, via the stimulation of
sympathetic activity. Therefore, when venous return to the heart increases, the
heart rate also increases, as well as cardiac output. Venous return also
directly affects the nodal cells. When there is an increase in venous return,
the atria receive more blood, and atrial walls stretch. The stretched SA node
cells result in faster depolarization, and increased heart rate.
Chemical Regulation
Heart rate is also influenced by many chemicals, especially
when they are present in very high or very low amounts. Hormones and ions are implicated
here. Hormones include epinephrine and thyroxine. During sympathetic
activation, epinephrine is liberated by the adrenal medulla. This hormone
produces equivalent cardiac effects to those from norepinephrine when it is
released by the sympa-thetic nerves. The heart rate and contractility are both
enhanced. Thyroxine from the thyroid gland increases production of body heat as
well as meta-bolic rate. In large amounts, the heart rate increases and remains
sustained. Thyroxine acts directly on the heart while enhancing effects of both
epi-nephrine and norepinephrine. Intracellular and extracellular ions, in
normal levels, also maintain normal heart function. When plasma electrolytes
are out of balance, the heart may be affected to a severe degree.
Other Types of Regulation
Heart rate is also influenced by age, body temperature,
exercise, and gender. The resting heart rate of infants is highest, at 140 to
160 beats per minute, but gradu-ally declines throughout life. Women have an
average heart rate that is higher than men’s. In women, this is 72 to 80 beats
per minute and in men, 64 to 72 beats per minute. Via the sympathetic nervous
system, exercise raises the heart rate and increases systemic blood pressure. In
a physically fit adult, resting heart rate is usually much lower than in people
who are out of shape. By enhancing the metabolic rate of cardiac cells, heat
increases heart rate. For example, a high fever often makes you feel as if your
heart is pounding rapidly. This is similar to the effects of extreme exer-cise,
because the muscles are generating large amounts of heat. Oppositely, the heart
rate is directly decreased by cold temperatures.
1. What causes the sounds of the heart?
2. What is a cardiac cycle?
3. Name the factors that affect cardiac output.
4. Differentiate between autonomic, chemical, and hormonal
regulation of heart rate.
5. What are common causes of tachycardia?