Model Development Procedures
| Home | | Medicinal Chemistry |Chapter: Medicinal Chemistry : Structure-Activity Relationship and Quantitative Structure Activity Relationship
2D descriptors are usually developed by using the atoms and connective information of the molecule, but 3D coordinates and individual conformations are not considered.
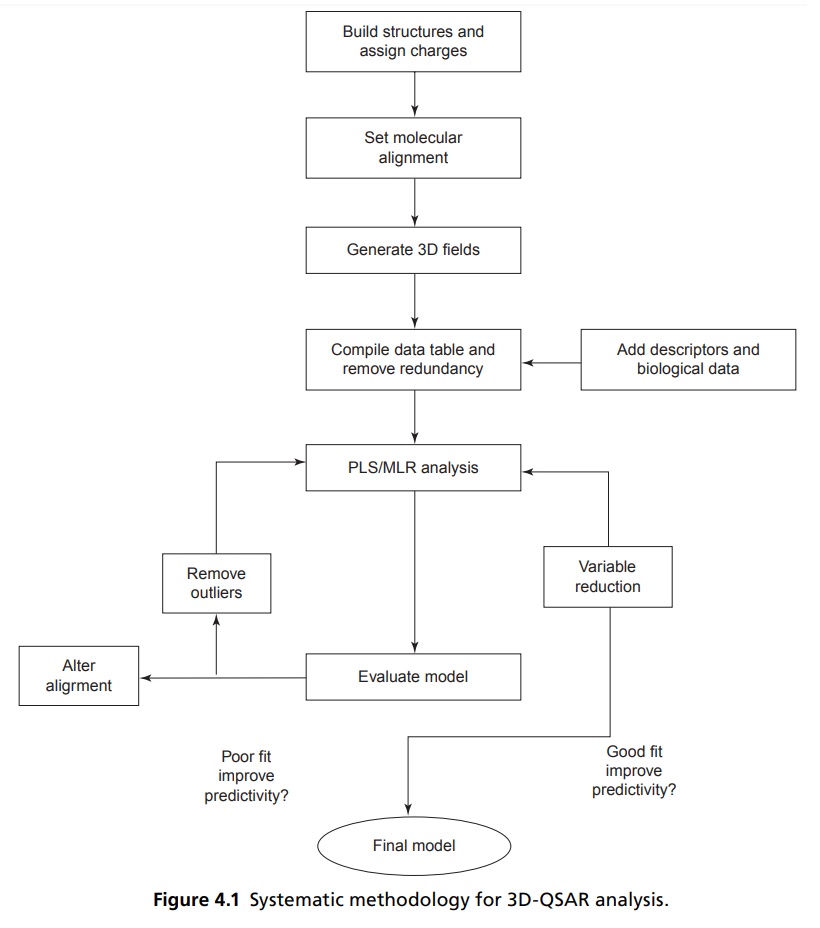
MODEL DEVELOPMENT PROCEDURES 2D descriptors are usually developed by using the atoms and connective information of the molecule, but 3D coordinates and individual conformations are not considered. In 2D QSAR, physicochemical parameters such as hydrophobic (π), steric (molar refractivity or MR), hydrogen acceptor (HA), hydrogen donor (HD), and electronic (field effect or F, resonance or R, Hammett’s constant or σ) are normally used. In addition to these parameters, de novo constants or indicator variables with 0 or 1 values denoting the absence or presence of certain features (cis/trans ring atom and bridge atom or chain, different test model, etc) are also used to adequately parameterize the compounds. In all this, many topological indices are also considered as parameters for analysis. Drug distribution and binding processes are equilibrium processes governed by the corresponding free energy differences, K = e–ΔG/RT = e–ΔH–TΔS)/RT, such relationships should use logarithmic scale. For these the biological inhibitory values, that is, IC50 or ED50 or LD50 or Ki must be converted into logarithmic form, such as log (1/IC50) or log (1/ED50) or log (1/LD50) or log (1/Ki) values to obtain appropriate activity parameters for the QSAR study. The logarithmic scales also ensure a normal distribution for the experimental error of biological tests, a requirement for regression-type statistical analyses. In some cases, the activity percentage (%) values (A) are converted to Log {A/(100 – A)} as a binding equilibrium constant, which physicochemically is more meaningful than A alone for QSAR analysis. Three-dimensional quantitative structure-activity relationships (3D-QSARs) are quantitative models that relate the biological activity of small molecules with their properties calculated in 3D space (Fig 4.1). Hence, 3D properties of a molecule are considered rather than that of the individual substituents. The 3D structures are usually generated from 2D or 2D with configurational information or 3D-structure database or X-ray crystallographic analysis or 2D NMR study. This structure is optimized to refine the geometry based on the size of the molecule such as molecular mechanics (large systems; thousands of atoms) or semi-empirical (medium size systems; hundreds of atoms) or ab initio (small systems; tens of atoms), in order to obtain one lowest energy structure per molecule. There are many 3D-QSAR techniques used for various purposes. A few of them are the following: Comparative molecular field analysis (CoMFA) Comparative molecular similarity indices analysis (CoMSIA) Molecular shape analysis (MSA) The distance geometry approach The binding site model approach COMPASS, the hypothetical active lattice method The molecular similarity approach Genetically evolved receptor models Among all the 3D-QSAR techniques, CoMFA is the most widely used technique and has shown unprecedented accuracy in prediction. Some of these approaches to QSAR are based on the statistical analysis of the 3D interaction fields. These are generated by measuring over a regular 3D grid the interaction energy between a small probe atom or a group and the ligands. Initially, the 3D structures of the training set of compounds are aligned based on common molecular features, so as to occupy the same volume of space. The interaction energies of the small probe, usually, a methyl group and a proton, is measured with each of the training set compounds at each grid co-ordinates in space. The interaction energy at each grid point in space becomes a descriptor in a QSAR analysis. It results in a data table containing several hundreds or even thousands of descriptors for the analysis. CoMFA is a 3D-QSAR technique employing both interactive graphics and statistical techniques for correlating the shapes and the biological properties of the molecules. It was proposed and developed by R.D. Cramer in 1988. The principle underlying CoMFA is that differences in a target property related to differences in the shapes of the noncovalent fields of tested molecules. The molecular shape of tested moelcule field into a QSAR table and the magnitude of steric (Lennard-Jones) and electrostatic (Coulombic) fields are sampled at regular intervals throughout a defined region of rigid box. To do so, bioactive conformation of each compound is chosen and they are superimposed in a manner defined by the supposed mode of interaction with the target receptor. Further, CoMFA compares the steric and the electrostatic fields calculated around the molecules with various probe groups in three dimensions and extract the important features related to the biological activity. With this information, CoMFA tries to identify the quantitative influence of the specific chemical features of the molecules on their potencies. In 3D space the contour plots result showing that biological activity important regions of designed or active molecules. Advantages of CoMFA technique include the prediction of activity of new compounds and representation of QSAR models in the form of contour maps. There are many important aspects that need to be considered for developing a good CoMFA model. They include the following factors: Biological data, selection of compounds, and series design, generation of 3D structure of ligand molecules. Conformational analysis of each molecule. Establishment of bioactive conformation of each molecule, binding mode and superimposition of the molecules. Position of lattice points, choice of force fields and calculation of interaction energies. Statistical analysis of the data and selection of the 3D QSAR model. Display of results in contour plots and interpretation of them, design and forecasting the activity of unknown compounds. The general methodology and crucial variables for CoMSIA are same as for CoMFA. The primary difference between them is that in case of CoMFA, the contribution due to dispersion forces between molecules are described by Lennard-Jones potential and electrostatic properties are characterized by Coulomb-type potential while in CoMSIA a special Gaussian function is considered for calculation of interaction energies. CoMSIA avoids some of the inherent deficiencies arising from the functional form of the LennardJones and Coulomb potentials used in the original version of CoMFA. Both the potentials are very steep, close to the Vander Waal’s surface and produce singularities at the atomic positions. As a consequence, the potential energy expressed at the grid points in the proximity of the surface changes dramatically. To avoid unacceptably large energy values, the potential evaluations are normally restricted to the regions outside the molecules and require the definition of some arbitrarily determined cutoff values. Due to the differences in the slope of the Lennard-Jones and Coulomb potentials, these cut-off values are exceeded at different distances from the molecules, requiring further arbitrary scaling of the two fields in a simultaneous evaluation, which can involve the loss of information about one of the fields. To overcome such problems, CoMSIA evaluates molecular similarity in space. Furthermore, in addition to the steric and electrostatic fields, CoMSIA defines explicit hydrophobic and hydrogen bond donor and acceptor descriptor fields, which are not available with standard CoMFA.Classical or 2D QSAR Analysis
3D-QSAR Analysis
COMPARATIVE MOLECULAR FIELD ANALYSIS (COMFA)
COMPARATIVE MOLECULAR SIMILARITY INDICES ANALYSIS (COMSIA)
Related Topics
