Proportional Reporting Ratios
| Home | | Pharmacovigilance |Chapter: Pharmacovigilance: Statistical Methods of Signal Detection
Proportional reporting ratios (PRRs) compare the proportion of reports for a specific ADR reported for a drug with the proportion for that ADR in all other drugs
PROPORTIONAL REPORTING RATIOS
Proportional
reporting ratios (PRRs) compare the proportion of reports for a specific ADR
reported for a drug with the proportion for that ADR in all other drugs (Evans,
Waller and Davis, 1998, 2001). The principles are not new, but were set out in
a similar way by Patwary (1969) and Finney (1974) for ADR reporting with WHO
data. The methods were not fully used subsequently, either in WHO or in the
United Kingdom, and were effectively reinvented in 1995 at the UK MCA, where
they have been used routinely since 1997. The PRR can also be seen as a
numerical version of the ADR profile; this simply uses a bar chart for a
particular drug giving the numbers in each system organ class (SOC). An
implicit comparison is made with a bar chart derived from another group of
drugs. A similar approach is used in classical epidemi-ology with death data –
the ‘Proportional Mortality Ratio’ (see, e.g., Rothman and Greenland, 1998).
The
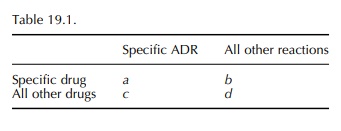
calculation of the PRR is very simple in prin-ciple as shown in Table 19.1:
PRR =
[ a/(a+b)] / [c/(c+d) ]
This
is analogous to a relative risk. An obvious alter-native is to use an odds
ratio (ad/bc) that may be regarded as a ‘Proportional odds ratio’ (POR). This
has slightly more desirable statistical properties than a PRR, but will be very
similar in magnitude since in most circumstances b >> a and d >> c.
When
a reaction is new and rare, then a (in the 2 ×2 table, Table 19.1) can be one or a
very small number, and it is possible that there are no other drugs with that
exact reaction. This means that b is zero and the PRR or POR is not calculable.
However, it is possible to use the table for practical purposes in a way that
is not exactly statistically rigorous. The second row can refer to all drugs rather than ‘all other drugs’.
This means that c is never zero and the POR or PRR is always able to be
calculated, and the estimated values are less than they would be otherwise.
This conservatism applies when the numbers are small and does no harm when
using the PRR or POR for prioritisation.
A
more general approach is to ask ‘What is the expected number of reports for
this ADR and this drug?’ and then to compare the observed number with the
expected number. A first attempt to obtain the expected number is to assume
that the proportion of reports for this ADR with this drug will be the same as
the proportion for this ADR in the database as a whole, PADR. The
expected number can then be obtained using the total reports for this drug, Ndrug:
EADR
drug = PADR ∗
Ndrug
The
deviation of the observed number from the expected number can be expressed as a
ratio, that is, the PRR:
PRR
= OADR drug/EADR
drug
This
approach can more easily be seen to be general-isable to allow the expected
number to be calculated in a less crude way. It can be modified to allow for
age and sex to be taken into account. This is equiv-alent to having a set of 2 × 2 tables stratified by age and sex,
where a POR can be derived using a general Mantel–Haenszel estimator from
several 2 × 2 tables (Rothman
and Greenland, 1998). It is also possible to use logistic regression to obtain
such an estimate.
These measures have allowed for the magnitude of the effect to be assessed;
they have not made any allowance for chance variation. The simplest way to make
such allowances is to calculate statistical significance tests of the
hypothesis that the PRR or POR is one. It is also possible to use the
equivalent confidence intervals (Tubert-Bitter et al., 1996). The usual chi-square test (corrected using Yates’
method to be conservative), or for stratified tables using the Mantel–Haenszel
method, can be calculated. This chi-square value indicates the contribution of
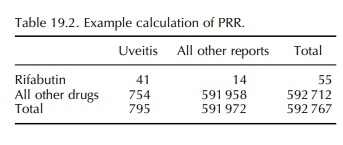
chance to the magnitude of the PRR. Table 19.2 gives an exam-ple of an extreme
PRR. . The proportion of reports of uveitis with
the drug rifabutin is (41/55)
= 0.75, while the proportion for all drugs is 754/591
958 = 0.0013 : PRR=586, chi-square = 22 736,p >> 0.00001.
It should be realised that all of this process should be used for the purpose of signal detection, and even more importantly, for prioritisation of the detected signals to help decide which ones require most urgent further investigation. The basic data are still subject to biases; they are at very best observational data, and to use a high value of a PRR or POR as the sole convincing evidence of causation is unwarranted. They raise a serious question that merits further study. At the same time, it should be remembered that where the reports are of suspected ADRs, then the reporter suspected a causal relationship and the fear that raised PRRs or PORs will generate too many false positive signals is probably also unjustified.
Related Topics
