Relative Risk and Odds Ratios
| Home | | Advanced Mathematics |Chapter: Biostatistics for the Health Sciences: Categorical Data and Chi-Square Tests
The concepts of relative risk and odds ratios are derived from epidemiologic studies.
RELATIVE RISK AND ODDS RATIOS
The concepts of relative risk and odds ratios are
derived from epidemiologic studies. A thorough discussion of them is beyond
the scope of this text. We refer the reader to Friis and Sellers (1999) or
Lachin (2000) for in-depth coverage of these topics. However, we will review
them briefly here, because they are common mea-sures that are germane to any
treatment of categorical data.
The relative risk is used in cohort studies, which
are a type of prospective study in which persons who have different types of
exposure to risk factors for disease are fol-lowed prospectively, meaning that
disease-free subjects are followed over time and the occurrence of new cases of
disease is recorded.
TABLE 11.10. 2 × 2 Table for Assessment of Relative Risk
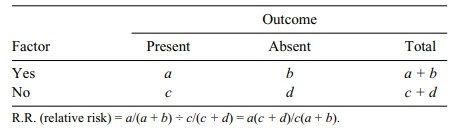
The occurrence of new cases of disease (known as incidence) is compared between subjects who have an exposure of interest and those who do not. Consequently, the
subjects must be free from the dis-ease of interest before the exposure occurs,
and they must be observed after a period of time to ascertain the effects of
exposure. In a cohort study, the measure of associ-ation between exposure and
disease is known as the relative risk (R.R.).
Relative risk is a number that can vary from very
low (approaching 0) to “large.” A relative risk of l suggests that the risk of
an outcome of interest is equally bal-anced between those exposed and not
exposed to the factor. As relative risk increas-es above 1, the risk factor has
a stronger association with the study outcome. Table 11.10 presents the format
of a 2 × 2 table for assessment of relative risk; a calcula-tion example is
provided in Table 11.11.
Researchers follow a cohort of 300 smokers and a
comparison cohort of non-smokers over a 20-year period. The relative risk of
lung cancer associated with smoking is 98/300 ÷ 35/700 = 6.53. These data
suggest that the smokers are 6.5 times more likely to develop lung cancer than
the nonsmokers. Sometimes the rela-tive risk can be less than 1. This value
suggests that the exposure factor is a protec-tive factor. For example, if the
incidence of lung cancer had been lower among the smokers, smoking would be a
protective factor for lung cancer!
A second type of major epidemiologic study is a
case-control study. This study is a type of retrospective study in which cases
(those who have a disease of interest) are compared with controls (those who do
not have the disease) with respect to ex-posure history.
For example, we might also study the association
between smoking and lung cancer by using the case-control approach. A group of
lung cancer patients (the cases) and controls would be assessed for history of
smoking. The odds ratio (O.R.) is the measure of association between the factor
and outcome in a case-control study. In Table 11.12, we provide a 2 × 2 table
for assessment of an odds ratio. The corresponding calculation example is shown
in Table 11.13.
TABLE 11.11. Smoking and Lung Cancer Data for a Cohort Study
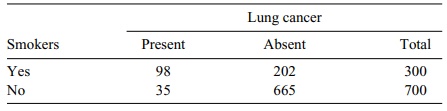
TABLE 11.12. 2 × 2 Table for Assessment of an Odds Ratio
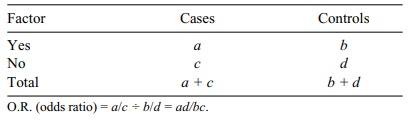
TABLE 11.13. Smoking and Lung Cancer Data for a Case-Control Study
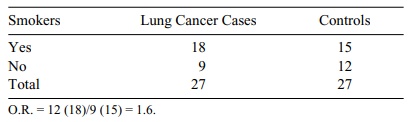
In this example, smokers were 1.6 times as likely
to develop lung cancer as non-smokers. Note that the odds ratio is a measure of
association that is interpreted in a similar way as a relative risk.
Note that throughout the foregoing examples we have
calculated only point esti-mates of relative risk. You might be interested in
confidence intervals or hypothesis tests. For example, if we could obtain a 95%
confidence interval for relative risk that did not include 1, we would be able
to reject the null hypothesis of no differ-ence at the 5% level. This topic is
outside the scope of the present text, but the in-terested reader can find the
asymptotic results needed for approximate confidence intervals on relative risk
in Lachin (2000), page 24.
Related Topics
