Case Series
| Home | | Pharmacovigilance |Chapter: Pharmacovigilance: Spontaneous Reporting - United States
This approach to signal identification and refinement is similar in concept to proportional morbidity ratios (Rothman and Greenland, 1998). Basically, the number of reports of a given ADR or of a group of ADR terms are viewed as a proportion of all ADRs reported for that drug.
CASE SERIES
The
most common approach to signal development is based on the evaluation of a
series of case reports. Although several criteria (described above) are used in
this review, no formal causality assessment algo-rithm is followed. Many such
algorithms have been reported in the literature, but these suffer from
impor-tant liabilities including inflexibility, lack of sensitiv-ity and lack
of validation (Pere et al., 1986;
Frick, Cohen and Rovers, 1997). They are also oftentimes difficult and time
consuming to use, may tend to discount even remotely confounded cases and may
place excess weight on the presence of positive rechallenge.
Because
the AERS database draws on the cumula-tive experience of nearly 300 million
people, it is a rich source of clinical material. A physician in practice may
see one case of a rare or unusual drug reaction and may perhaps even publish
the case. The advantage of a centralized ADR repository is that it offers the
potential of much greater case numbers and with that comes the capacity to
describe the spectrum and natu-ral history of the reaction and to identify risk
factors for its occurrence.
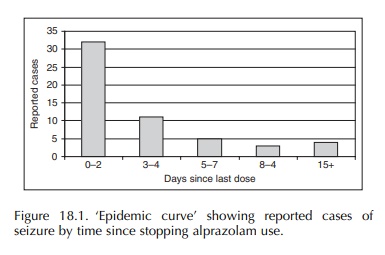
Several
examples help to illustrate this. Based on a review of 121 cases of seizure
reported with alpra-zolam, the importance of the duration of drug use and the
sudden cessation of therapy were identified as risk factors for seizure
occurrence (Graham, 1989). The ‘epidemic curve’ derived from these case reports
strongly suggested benzodiazepine withdrawal as the underlying mechanism
(Figure 18.1). The evaluation of 95 reported cases of hemolysis with the use of
the antibiotic temafloxacin resulted in the discovery of hemolytic-uremic
syndrome with this drug and iden-tified prior fluoroquinolone use as a strong
risk factor for the development of this life-threatening compli-cation (Blum,
Graham and McCloskey, 1994). More recently, a review of 89 cases of acute liver
failure reported with the use of troglitazone described the clinical spectrum
and natural history of this disor-der (Graham et al., 2003). Of note, this analysis provided evidence of the
inability to predict who was at risk of this frequently fatal reaction. It also
demonstrated that liver enzyme monitoring would not prevent liver failure
occurrence with troglitazone. In another instance, a review of 58 case reports
suggested a possible association between the use of the antifun-gal, itraconazole
and the development of congestive heart failure (Ahmad, Singer and Leissa,
2001). No evidence of a similar signal was observed with the other azole
fungicides.
PROPORTIONAL DISTRIBUTIONS
This
approach to signal identification and refinement is similar in concept to
proportional morbidity ratios (Rothman and Greenland, 1998). Basically, the
number of reports of a given ADR or of a group of ADR terms are viewed as a
proportion of all ADRs reported for that drug. The resulting measure can serve
to highlight specific drug reactions or show a cluster-ing of different
reactions, all of which affect a partic-ular organ or body system. Of perhaps
greater utility, a drug’s proportional distribution can be compared with that
of other drugs in the same pharmacologic class or with drugs from other classes
used to treat the same indication. From this type of analysis, one might
observe that a particular antibiotic has a relatively high proportion of
skin-related ADRs compared with other class members. As with proportional
morbidity ratios, proportional distributions are useful in a qualitative sense,
revealing potential ‘problem areas’ for a drug. However, they do not contribute
to our understanding of ADR incidence.
REPORTING RATES
In
its simplest form, a reporting rate is the number of reported cases of a
particular ADR divided by some measure of the suspect drug’s utilization,
usually the number of dispensed prescriptions. As such, they are not true
rates, but convention refers to them thus. An epidemiologic modification of the
reporting rate ‘denominator’ employs an estimate of the total person-time of
exposure to the drug in the general population rather than the total number of
dispensed prescriptions.
The
reporting rate of an ADR can be compared between different drugs. A review of
case reports identified a signal of pulmonary fibrosis with the anti-androgen,
nilutamide, used in the treatment of prostate cancer. Reporting rates, adjusted
for market age and calendar time, were calculated for this drug and two other
anti-androgens marketed in the United States for the same indication. This
analysis found a much higher reporting rate with nilutamide and led to changes
in product labeling (Ahmad and Graham, 2003).
Reporting
rates must be interpreted carefully because they are not incidence rates. True
rates incor-porate the element of time and depend upon the complete
ascertainment of the event being measured within a defined population (Clayton
and Hills, 1993). These requirements do not hold for reporting rates. Using
person-time rather than prescription number as the denominator of the reporting
rate still does not give rise to an incidence rate because most ADRs are not
reported, and hence the reporting rate will seri-ously underestimate the true
incidence. The failure of most ADRs to be reported to the FDA or other
pharmacovigilance centers is referred to as underre-porting. This is the single
greatest limitation of using spontaneous case reports to monitor drug safety.
After an ADR occurs, a series of barriers must be overcome if this event is to
reach the ‘in-box’ of a safety eval-uator. These are (a) recognition and
correct diagnosis of the clinical event, (b) attribution of that event to a
drug exposure and (c) registration of the event (filing a report) with the drug
company or the FDA (Graham, Waller and Kurz, 2000). These barriers generally
reduce the level of reporting of serious ADRs to the range of 1%–10% (Inman and
Adelstein, 1969; Inman and Weber, 1986; Scott et al., 1987; Rogers, Israel and Smith, 1988; Belton et al., 1995; Eland et al., 1999, La Grenade, Graham and Nourjah, 2001).
OBSERVED-TO-EXPECTED ANALYSIS
A
natural extension of the concept of reporting rates is the technique of
observed-to-expected analysis. This approach to signal refinement is more
epidemi-ologic in nature than the above described methods. To employ this
approach, it is necessary to have an estimate of the background rate for the
clinical event of interest in the general population. Such rate infor-mation
may be found in published literature or possi-bly through other sources such as
the US National Center for Health Statistics (La Grenade, Kornegay and Graham,
2000).
The
other piece of information that must be obtained is an estimate of the total
exposure-time to the drug of interest within the population. This estimate is
usually derived from data estimating the total number of prescriptions
dispensed for a specific drug, along with an estimate of the average
prescription length in days. At the FDA, such data are usually available
through a contract with a commercial drug-utilization data vendor. This
information is sometimes supplemented by the use of extramural databases that
provide access to large, automated claims data from population-based healthcare
plans (Graham, Waller and Kurz, 2000).
Two
examples illustrate this method. Returning to nilutamide and pulmonary
fibrosis, the person-time of drug exposure in the US population was esti-mated
using commercially available data (Ahmad and Graham, 2003). The background rate
for ‘idiopathic’ pulmonary fibrosis was obtained from a population-based
epidemiologic study (Coultas et al.,
1994) and was applied to the accumulated person-time of expo-sure to nilutamide.
This analysis found that the number of spontaneous case reports of pulmonary
fibrosis with this drug was 15-fold greater than expected.
An
evaluation of ADR reports for clozapine found 47 reports of myocarditis and
cardiomyopa-thy, with a sizable proportion occurring within the first few
months of starting therapy. A literature review produced a population-based
estimate for fatal myocarditis of 4 per million person-years (Murray and Lopez,
1992). To determine the total US exposure-time to clozapine, FDA
epidemiologists turned to the US National Clozaril Registry and obtained the
number of patients ever treated with the drug (Honigfeld et al., 1998). The cumulative patient-time for the first month of
drug use was calculated and an estimate of the expected number of fatal cases
of myocarditis derived. This analysis showed a 321-fold excess in fatal reports
of myocarditis in the first month of clozaril use (La Grenade, Graham and
Trontell, 2001).
This
method works best when the background rate for the clinical event of interest
is very low. In the above examples, the background rates were in the range of a
few per 100 000 to a few per 1 000 000 per year. With more common events, such
as myocardial infarction or asthma, the expected number of cases becomes large,
thereby greatly reduc-ing the signal-to-noise ratio. Because of the pres-ence
of large-scale underreporting of ADR cases, the lack of an excess number of
reports over the number expected cannot be interpreted by itself as
invalidating the signal. However, the strength of the method is demonstrated in
those situations where the reported number (‘observed’) is close to or exceeds
the expected number. Because of underreporting, the actual level of risk is
much greater than that obtained. In such instances, one has moved beyond signal
towards establishing an association.
‘CASE–CONTROL’ ANALYSES
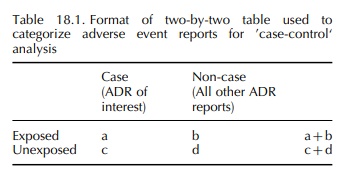
Another approach for signal development borrows heavily from the case–control method of standard clin-ical epidemiology (Breslow and Day, 1980; Kahn and Sempos, 1989). The simplest variant of this approach identifies all ADR cases describing a particular event of interest within a national center’s pharmacovig-ilance database. These will serve as ‘cases’ in the analysis. All other reports in the database serve as non-cases or ‘controls’. Reports listing the drug under investigation are classified as ‘exposed’, regardless of their status as a case or non-case. Similarly, reports not listing the drug of interest are ‘unexposed’. A two-by-two table is created, and an odds ratio is calculated as the cross-products ratio ((a × d /(b × c (Table 18.1). Moore et al. (1997) used this approach to chart the emergence of a signal and its progression over a period of months.
A
modified version of this approach has been devel-oped at the Medicines and
Healthcare Regulatory Agency in the United Kingdom (Wiholm et al., 2000). The proportional reporting ratio is calculated from
the same two-by-two table as with the case–non-case method above. However,
instead of deriving a cross-product ratio, a ratio of proportions among the
exposed and unexposed is computed, analogous to the epidemiologic concept of
relative risk ([a/(a +
b ]/ [c/(c + d ]).
The
above two approaches rely solely upon data contained within the national
pharmacovigilance database. A third variant supplements case reports data with
population-based data obtained from large automated healthcare databases
(Graham, Waller and Kurz, 2000). This method was helpful in assessing the
effect of daily dose and cumulative duration of use on the risk of experiencing
withdrawal seizures following abrupt cessation of the benzodiazepine,
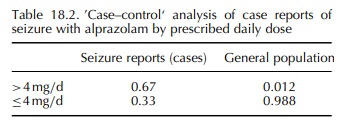
alprazolam (Graham, 1989). A nested case–control design was used for this study,
with all cases and non-cases exposed to alprazolam. From the AERS database, all
cases of seizure reported with alprazolam were reviewed, and data on daily dose
and duration of use abstracted. Reports were coded into binary categories for
each of these two potential risk factors (dose: >4 vs. ≤4 mg/day; duration: >4 vs. ≤4 months), and the proportion of
cases in each category was calcu-lated. From a population-based healthcare
database, the proportional distribution of alprazolam users in each of the dose
and duration categories was obtained. A two-by-two table was created in which
each of the four cells contained the relevant proportion from the 121 AERS
seizure reports (‘cases’) and from the general population of alprazolam users
(‘controls’). The resulting cross-products ratio yielded an odds ratio of 39
for seizure risk with higher dose alprazo-lam use (Table 18.2).
An
advantage of this approach is that an unbiased measure of exposure is obtained
from a general popu-lation of drug users that can usually be assumed to be
representative of all users nationally. It thereby serves as an unbiased
estimate of the source population from which the reported cases emerge. If the
probability of the ADR being reported is unlikely to be influ-enced by the
exposure of interest (e.g. dose), a reason-able estimate of the relative risk
may be obtained. In this circumstance, underreporting does not affect the
observed result.
SURVIVAL ANALYSIS
One
final technique, recently developed to enhance the information content of
spontaneous case reports data, employs principles of time-to-event and survival
analysis to the evaluation of ADR reports (Kahn and Sempos, 1989; Graham et al., 2003). The tech-nique requires
access to nationally representative population-based drug use data to model the
pattern of duration of use in the general population. In a clin-ical trial or
longitudinal observational cohort study, patients who drop out before study
completion are censored at that point in time, and only the time during which
they were in the study is considered in the analysis (Piantadosi, 1997).
Life-table techniques are common means of accurately accounting for changes in
the size of the population at risk resulting from withdrawals (Clayton and
Hills, 1993; Kelsey et al., 1996). By
use of this method, one can calculate interval-specific reporting/hazard rates
(e.g. for the first, fifth or twelfth month of product use) as well as the
cumulative risk of an ADR being reported through a given point in time, such as
after 1 or 3 years of continuing drug use.
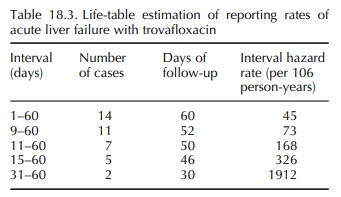
The
method is complex but useful. It was used to demonstrate the association
between risk of devel-oping acute liver failure and the duration of use of
trovafloxacin, a fluoroquinolone antibiotic. Over about a 2-year period, the
FDA received 14 reports of acute liver failure associated with trovafloxacin
use (Public Health Advisory, 1999). In an effort better to characterize the
contour and magnitude of risk over time, the survival technique was used. For compari-son
purposes, the background incidence rate for acute liver failure due to
“idiopathic” causes was previously estimated at one case per million per year
(Graham and Green, 1999). Based only on reported
cases, the relative risk of acute liver failure was increased from the start of
therapy and increased rapidly with increas-ing duration of exposure (Table
18.3). This technique was also used to show that the risk of acute liver
fail-ure was substantially increased with troglitazone use during the first month
of use and remained elevated for as long as patients remained on drug (Graham et al., 2003).
Related Topics
