Data Analysis and Presentation
| Home | | Pharmacovigilance |Chapter: Pharmacovigilance: Medical Dictionary for Regulatory Activities (MedDRA)
Here we are concerned with the analysis–including quantifying–and presentation of adverse event (and other medical) data that has been coded using MedDRA, as distinct from searching the database and finding the relevant cases.
DATA ANALYSIS AND PRESENTATION
Here
we are concerned with the analysis–including quantifying–and presentation of
adverse event (and other medical) data that has been coded using MedDRA, as
distinct from searching the database and finding the relevant cases. The
principal issues are the large number of terms in MedDRA; the most appro-priate
levels and groupings for the required purpose; multiaxiality; and version
changes.
The
large number of terms in MedDRA (in particu-lar, PTs) may complicate analyses involving
counts of events. For example, if adverse events from a parallel group clinical
trial with 100 patients in each treatment arm had been coded using a legacy
dictionary such as COSTART, we might see an event such as paraes-thesia
occurring in 10% of patients receiving Treat-ment A and in 2% of those
receiving Treatment B. However, if there were actually more specific symp-toms
of paraesthesia described by trial subjects and recorded by the investigators,
the differences between treatment groups might be less apparent when using
MedDRA PTs, as shown in Table 13.9.
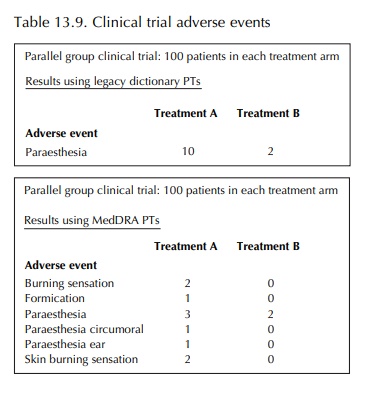
By
contrast, if analysis had been carried out using the respective HLT, Paraesthesias and dysesthesias, the 10%
versus 2% difference would have been main-tained. The use of group terms in
analyses might also prove problematic, however. Thus, some HLTs – especially in
the Investigations SOC – include PTs that represent opposing concepts. For
example, the HLT Platelet analyses
includes PTs Platelet count decreased, Platelet count increased,
Platelet count abnormal and Platelet
count normal. Such a group-ing would not be helpful if comparing effects on
platelets between two treatments. In other instances, MedDRA groupings may
include terms representing concepts that, whilst not in opposition, are
signifi-cantly different medically. As an example, ten reports of an adverse
event represented by the HLT Ventric-ular
arrhythmias and cardiac arrest might relate to ten cases of Torsade de
Pointes (a particularly seri-ous type of arrhythmia) or ten cases of Ventricular extrasystole (a generally benign and mild form of rhythm disorder).
A
review of some of the adverse events commonly seen in clinical trials (Brown,
2004) showed that the use of MedDRA PTs might increase the number of available
terms (and hence ‘dilute’ differences between treatment arms) dramatically.
However, in practice, the ratio of MedDRA to WHO-ART PTs in clinical trials has
been reported as around 2:1 (Kubler et al.,
2005).
Presentation
of adverse event data using MedDRA is also the subject of ‘Points to Consider’
Guide-lines (MedDRA Data Retrieval and
Presentation, 2004). Many of the points are identical to those concerning data
retrieval, or have been described above. However, the Guidelines describe a
number of approaches to presenting data for various purposes and discuss the
advantages and disadvantages of these.
Thus,
an overall presentation of the safety profile highlights the distribution of
ADR/AEs across SOCs and helps identify areas where more in-depth analysis
should be conducted. The Guidelines recommend that data should be presented in
a way that allows ready recognition of patterns of terms potentially associated
with relevant medical conditions. They point out that the conventional display
of data as PTs under the respective SOCs alone may not optimally represent the
frequency of events and can be misleading. For example, if a number of reports
describe a similar medical condition, they could be represented under various
specific PTs, so that it may not be apparent that they are associated.
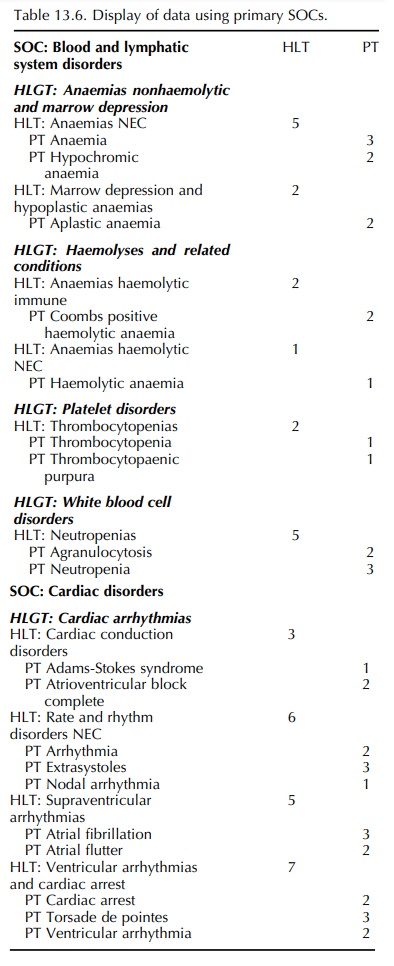
As a first look, one should display all data as an overview according to primary SOC, including HLGTs, HLTs and PTs (as in Table 13.6). This applies to standard tables for clinical trial and post-marketing adverse reaction data and post-marketing cumulative summaries. It assures that all events will be seen and the overview might be useful in identifying clusters, perhaps in an HLT or HLGT. For a small data set, this might be all that is required. This overview can be used as the basis for planning more in-depth analyses.
Line
listings (both clinical and post-marketing data) can also be displayed by
primary SOC and PT. While it might be sufficient to use these for small data
sets, the Guidelines indicate that it might be preferable to display data by
HLGTs and HLTs as well as show-ing SOC and PTs for more complex data. Graphical
display such as histograms, bar charts and pie charts showing event terms might
facilitate understanding by the viewer.
In
some situations, the Guidelines suggest that a more focused presentation of
data may be required, in addition to the Overview by Primary SOC. For exam-ple,
when reviewing in more depth any clusters seen in Primary SOC output, or for
looking at previously identified safety concerns, monitoring events of special
interest or responding to regulatory and other queries, it may be appropriate
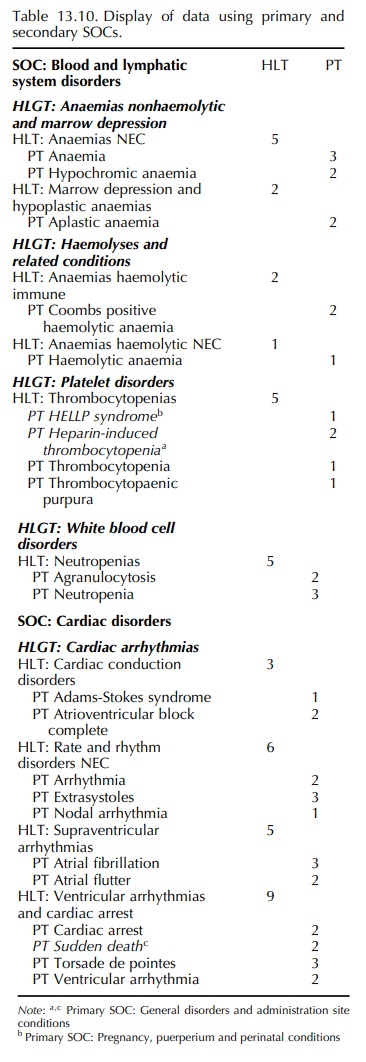
to expand the presentation by showing additionally terms in their secondary
(mulitaxial) SOC locations. The Guidelines recommend display of the SOC or the
HLGT/HLT relevant to the search, showing all the primary and secondary terms.
An example of such a presentation is shown in Table 13.10. It must be
remembered that, using this method, displaying more than one SOC may lead to
double (or a higher multiple) counting of terms. The Guidelines also suggest,
if appropriate, the linking of relevant PTs from the three non-multiaxial SOCs
(i.e., SOC Investigations, SOC Surgical and medical procedures and SOC
Social circumstances). However,
for medical conditions that are likely to involve terms in more than one SOC,
it is proposed that users should consider using an SMQ.
Related Topics
