Rationale for Proportional Methods
| Home | | Pharmacovigilance |Chapter: Pharmacovigilance: Statistical Methods of Signal Detection
A basic question to be asked is whether the use of the proportion of reports for a particular reaction (compared with all reports) is sensible.
RATIONALE FOR PROPORTIONAL METHODS
A basic
question to be asked is whether the use of the proportion of reports for a
particular reaction (compared with all reports) is sensible. As a first step,
it is reasonable to examine the trends in proportions of reports over time
within a major database. Figure 19.1 below gives the cumulative total number of
reports and the cumulative number of reactions reported as suspected ADRs in
the UK MCA database (Waller, Coulsen and Wood, 1996). This database, called
Adverse Drug Reactions Online Information and Tracking (ADROIT), has suspected
ADRs reported on Yellow Cards since 1964. Over this period, the number of
reports in the database has risen dramatically but the pattern in proportions
in different SOCs has remained relatively stable.
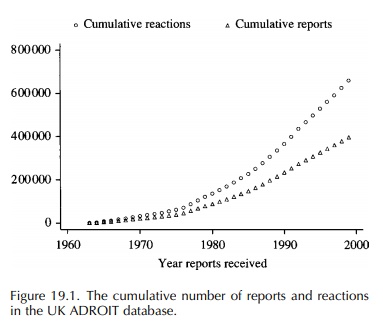
Figure 19.1 shows the cumulative
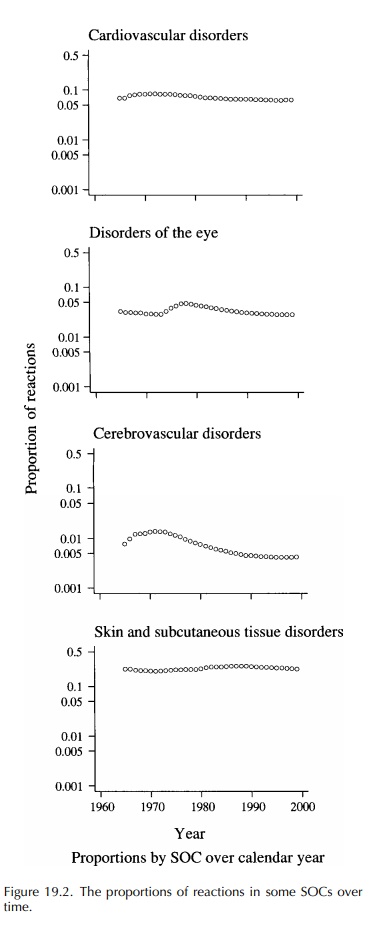
number of reports and reactions by year. Figure 19.2 shows the cumulative
proportion (on a log scale) of reactions reported for a cross section of the
SOCs. These show that cardiovascular reports are stable at a high level, while
‘ear’ reports are fairly stable at a low level. Eye reactions show a notable
rise in 1974 – a result of practolol. Skin reactions are stable at a high level
with a peak in 1982 (benoxaprofen).
Related Topics
