Risk Estimaton From SR
| Home | | Pharmacovigilance |Chapter: Pharmacovigilance: Statistical Methods of Evaluating Pharmacovigilance Data
As previously mentioned, the actual number a of cases that have occurred during the surveillance period t could theoretically be estimated by a = k · U,
RISK ESTIMATON FROM SR
ESTIMATION OF THE NUMERATOR
As previously mentioned, the actual
number a of cases that have occurred during the surveillance period t could
theoretically be estimated by
a = k · U,
where k is the number of reports during the surveil- lance period and U is the under-reporting coefficient
varying from one (exhaustive reporting) to infinite (i.e. the reporting rate is
null).
Unfortunately, it is extremely
difficult and/or hazardous to estimate the magnitude of this under- reporting,
even if in most cases it can be thought to be huge, even for serious cases
(Alvarez-Requejo et al., 1998; Eland et al., 1999).
For example, in 1998 a
nation-wide prospective study conducted in a representative sample of French public
hospitals estimated that 128 768 patients (95% CI: 100 916–156 620) were
admitted that year in these hospitals because of an ADR (Pouyanne et al., 2000). This study did not
consider other aspects of serious- ness such as death, nor admissions to
private hospi- tals. Nevertheless, the obtained figure (128 768) was far larger
than the number of serious reactions (about 15 000) reported during the same
period to the French pharmacovigilance system still considered as particu-
larly efficient.
The capture–recapture approach, when applica- ble, could appear
appealing to estimate the total number of cases of a given effect that have
occurred in the surveyed population (Jeeger, Schumock and Kong, 1996). This
approach derives the size of the source-population from the number of
individuals both ‘captured’ by two independent samplings from this population
(a more accurate estimate would be obtained by a greater number of samplings,
e.g. three or four). To apply this method to pharmacovigi- lance consists in
considering two or more independent sources of reports in the same territory.
For instance, if k1 and k2 reports have been
collected, respectively, during the same period, through two independent
sources, for example the regional pharmacovigilance centres network and the
concerned manufacturer and if c was
the number of duplicates (i.e. cases identified by both sources 1 and 2), then
the total number of cases would be
a = k1·k2 /
c
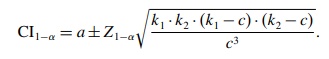
If k1 and k2
were large enough (e.g. ≥ 15), the normal approximation can be used to
calculate the 1 – α confidence interval (CI) for a:
Example: During a one-year
surveillance period, 127 cases were reported to the first system and 42 to the
second; 12 duplicates were identified. The estimate for the total number of
cases is
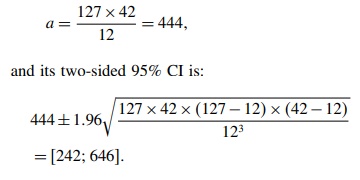
One
can deduce that the actual number of cases has 95 chances in a hundred of being
between 242 and 646. The number of cases identified by SR being 127 + 42 − 12 = 157, the reporting ranges between 24%
and 65%.
However,
the validity of such an estimate requires that reporting to one system or the
other be a truly random and independent phenomenon which could be an unverified
assumption. For this reason, the safest way is probably to cease to estimate
the actual number of cases and to deal with reporting
rates instead of incidence rates!
ESTIMATION OF THE DENOMINATOR
In
some countries, the size N and characteristics of the exposed population and
its conditions of expo-sure can be precisely derived from health insurance
databases. In this case, except for the poor quality of case collection (i.e.
under-reporting), SR approaches the cohort design.
Unfortunately,
in most cases, it is necessary to esti-mate these parameters from sales
statistics and/or drug prescription on drug utilization panels (Bégaud, Péré
and Miremont, 1993). The use of such aggregated data precludes any possibility
of considering some individual or sub-group characteristics in the analysis.
The
necessary ‘ingredients’ for computation are: the number of exposure units, for
example tablets, capsules, injection doses sold in the territory during the
relevant period of time, and the average daily dose (ADD) of the considered
drug used in this population, the latter being estimated from prescription
panels or other sources. By default, the defined daily dose or the recommended
daily dose (RDD) can be used as proxy.
Example: 780 000 packages
of 20 capsules have been sold in a
1-year period, the used daily dose is 2.1 capsules. This corresponds to the
quantity necessary for a cumulative duration of treatment of: (780 000 × 20 2 1 = 2 666 667 days, or 87 719 months.
In a more epidemiological parlance, the expo-sure level in the
source-population is 87 719 person-months.
As
for incidence density calculations, this total probably sums individual
exposure periods which are extremely different. Moreover, because of its
ecologi-cal character, this approach precludes any risk analysis based on the
duration of exposure.
To
estimate the number of treatments or the number of subjects treated would
require knowing the average duration of a treatment (ADT) with the considered
drug. In the previous example, if the ADT was 23 days, the number of treatments
for the considered period would be: 2 666 667/23 = 115 942.
However,
in the absence of direct information from a health insurance database, the use
of measurements made on panels or relatively small samples, both for the
average daily dose and duration of treatment, will greatly increase the
statistical instability of the esti-mate. In the previous example, if the 95%
CIs were [1.6; 2.7] and [16; 31] for the ADD and ADT, respec-tively, then the
CI for the number of treatments would range from 31 860 to 104 167. For this reason,
it is often preferable to keep person-time estimates for further calculations.
ESTIMATION OF REPORTING RATES
As
for incidence rates, the number of cases reported during a given period of time
is standardized for the corresponding person-time denominator. For exam-ple, if
18 cases of severe neutropenia have been reported for a cumulative exposure
time (estimated from sales statistics) of 87 719 months, the reporting rate is
18/87 719 = 2 05 for 10 000
person-months of exposure. It is sensible to consider that the occur-rence of
cases in the exposed population and their reporting, both correspond to a
pseudorandom process which can be described by an ad hoc probability model. Given that, in pharmacovigilance, the
source popu-lation is generally extremely large and the probabil-ity of
occurrence very low, the Poisson distribution is expected to be quite a
satisfactory model (Snedecor and Cochran, 1989). In these conditions, the
calcula-tion of the 95% two-sided CI for the reporting rate consists of
considering the lower and upper limits for the Poisson parameter read in a
table such as Table 20.1
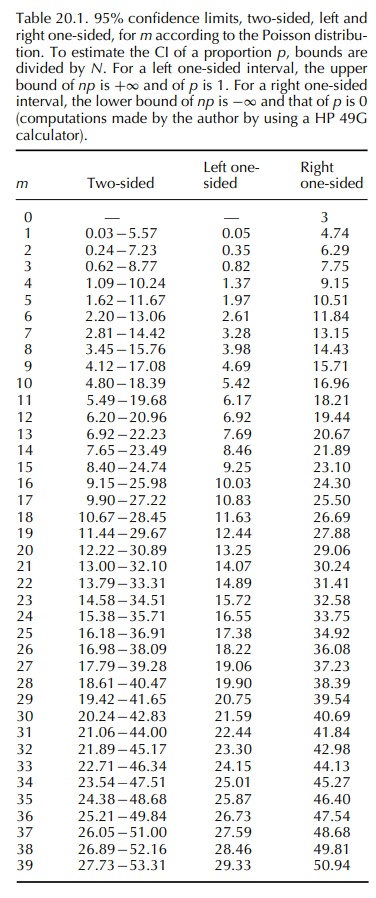
In
the above example, the 95% Poisson CI for the observed number 18 is [10.67;
28.45]. The CI for the reporting rate is thus 10.67 to 28.45 for 87 719 months,
that is 1.2 to 3.2 per 10 000 personmonths of exposure. When the number k of
reports is large enough, that is 15 or preferably 30, the CI can be calculated
by using the normal approximation for a Poisson count (Daly, Bourke and
McGilvray, 1991):
CI
= k ± Z1−a √k
In
both cases, this CI defines the set of values which could be observed because
of the sampling variation, all parameters remaining identical.
Related Topics
