Cell Kinetics
| Home | | Pharmaceutical Technology |Chapter: Pharmaceutical Engineering: Bioprocessing
The principles of bioreactor design require understanding the phenomena intended to take place in these controlled environments.
CELL KINETICS
Definitions
The
principles of bioreactor design require understanding the phenomena intended to
take place in these controlled environments. This relates to the growth
kinetics of prokaryotic or eukaryotic cells derived from animal, plant, or
microbial origins. The complexity of biochemical reactions and transport
phe-nomena render accurate predictive mathematical modeling impossible since
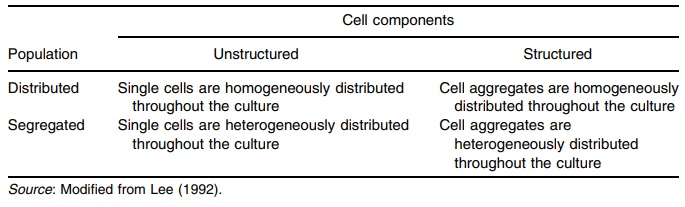
the system consists of multiple phases having many components. Attempts have
been made to estimate growth kinetics based on a matrix combining unstruc-tured
or structured approaches to distributed or segregated models (Table 16.2).
Growth Cycle
The
growth cycle of cells has been documented for over a century. It consists of
six phases that describe cells growth from an initial period of accommodation
or acclimatization through to exhaustion or overpopulation of the environment.
The lag phase, which occurs when cells are introduced into a medium, is a
period of time when no net change in cell number occurs. This phase is followed
by an accelerated growth phase when the cell numbers start to increase and the
division rate increases to reach a maximum in the exponential growth phase,
where the division rate is proportional to dln Cn0/dt, which is
constant at maximum value. Following this maximal growth rate, a deceleration
in both growth and division occurs. The cell population finally reaches a
maximum value, but the death of growing cells occurs as nutrients are depleted.
TABLE 16.2 Various Models for Cell Kinetics
Monod Kinetic Parameters
Much
has been written regarding the growth of cells in fermenters and chemostats
(Lee, 1992). The kinetic considerations in these systems are briefly summarized
below.
The
Monod equation is an empirical expression describing the effect of substrate
concentration on the specific growth rate, and it takes a form similar to
Michaelis–Menton enzyme kinetics or the Langmuir adsorption isotherm:
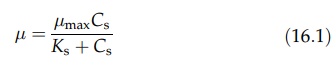
where
μ and μ max are growth rate and
specific growth rate at half-maximum value, and Ks and Cs
are a system coefficient and concentration of the limiting substrate in the
medium, respectively.
Monod
kinetic parameters specific growth rate at half-maximum and the system
coefficient cannot be estimated with a series of individual studies as easily
as Michaelis–Menton kinetics for enzyme action. The initial reaction rate can
be measured accurately as a function of substrate concentration for enzymes.
Cell cultures undergo an initial lag phase in growth in which Monod kinetics do
not apply. Even though the Monod equation has the same form as the
Michaelis–Menton equation, the rate equation is different.
The
Michaelis–Menton equation describing enzyme activity takes the form
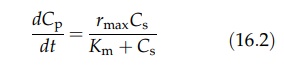
where
Cp and Cs are product concentration and substrate
concentration, respectively, and Km is the rate constant. The Monod
equation takes the form
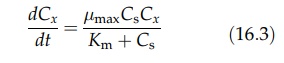
Note
that the cell concentration term Cx in the Monod equation is absent
from the Michaelis–Menton equation.
Measuring
the steady-state substrate concentration at various flow rates, one can test
various kinetic models and estimate the value of the kinetic parameters.
A
linear relationship can be derived as follows:
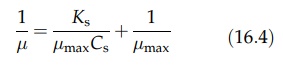
where
μ is equal to the
dilution rate (D) for a chemostat. If a certain microorganism follows Monod
kinetics, the plot of 1/ μ
versus l/Cs yields the values of μ max and Ks
by reading the intercept and the slope of the straight line. This plot is the
same as the Lineweaver–Burk plot for Michaelis–Menton kinetics. Since 1/ μ approaches infinity as the
substrate concentration decreases, the data is weighted too heavily at low
substrate concentrations and insuffi-ciently at high substrate concentrations.
Nevertheless, this approach has the advantage of showing the relationship
between the independent (Cs) and dependent variables (μ). Figure 16.1 illustrates the
manner in which the specific growth rate may be derived from a plot of
reciprocal dilution rate versus reciprocal substrate rate.
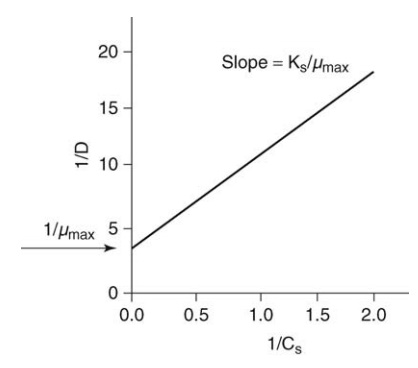
FIGURE 16.1 Reciprocal dilution rate for a
chemostat plotted against reciprocal substrate concentration.
