Evaluation of Potential Chemotherapeutic Antimicrobials
| Home | | Pharmaceutical Microbiology | | Pharmaceutical Microbiology |Chapter: Pharmaceutical Microbiology : Laboratory Evaluation Of Antimicrobial Agents
Unlike tests for the evaluation of disinfectants, where determination of cidal activity is of paramount importance, tests involving potential chemotherapeutic agents (antibiotics) invariably have determination of MIC as their main focus.
EVALUATION OF POTENTIAL CHEMOTHERAPEUTIC ANTIMICROBIALS
Unlike tests for the evaluation of disinfectants, where determination of
cidal activity is of paramount importance, tests involving potential
chemotherapeutic agents (antibiotics) invariably have determination of MIC as
their main focus. Tests for the bacteriostatic activity of antimicrobial agents
are valuable tools in predicting antimicrobial sensitivity/tolerance in
individual patient samples and for detection and monitoring of resistant
bacteria. However, correlation between MIC and therapeutic outcome are
frequently difficult to predict, especially in chronic biofilm-mediated
infections. The determination of MIC values must be conducted under
standardized conditions, since deviation from standard test conditions can
result in considerable variation in data.
a) Tests For Bacteriostatic Activity
The historical gradient plates,
ditch-plate and cup-plate techniques have been replaced by more quantitative
techniques such as disc diffusion (Figure 18.4),
broth and agar dilution, and E-tests (Figure 18.5).
All employ chemically defined media (e.g. Mueller-Hinton or Iso-Sensitest) at a
pH of 7.2–7.4, and in the case of solid media, agar plates of defined
thickness. Regularly updated guidelines have been provided by the National
Committee for Clinical Laboratory Standards (NCCLS) and are widely used in many
countries, although the British Society for Antimicrobial Chemotherapy has
produced its own guidelines and testing procedures (Andrews, 2009).
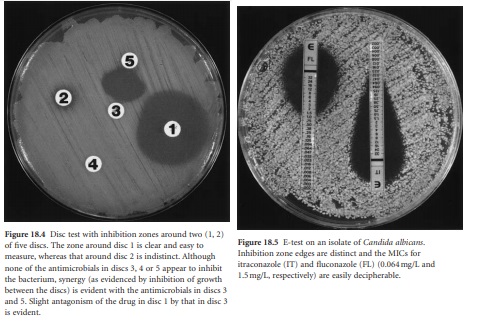
i) Disc tests
These are really modifications of the earlier
cup or ditch plate procedures where
filter-paper discs impregnated with the antimicrobial
replace the antimicrobial-filled
cups or wells. For disc tests, standard
suspensions (e.g. 0.5 McFarland standard) of log-phase growth cells are prepared and inoculated on to the surface of appropriate
agar
plates to form a lawn.
Commercially available filter paper discs containing known concentrations of antimicrobial agent (it
is possible to prepare your
own discs for use
with novel drugs)
are then placed
on the dried
lawn and the plates
are incubated aerobically at 35 °C for 18 hours. The density of bacteria inoculated on to the plate
should produce just
confluent growth after
incubation. Any zone
of inhibition occurring around the disc
is then measured, and after comparison with known standards, the bacterium under
test is identified as susceptible or resistant to that particular antibiotic. For novel
agents, these sensitivity parameters are only available after
extensive clinical investigations are correlated with laboratory
generated data. Disc tests are basically
qualitative; however, the diameter of the zone of inhibition may be correlated to MIC determination through a linear
regression analysis (Figure 18.6).
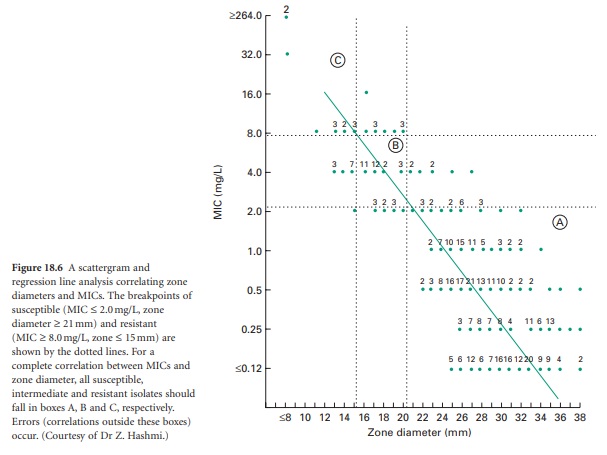
Although subtle
variations of the disc test are used
in some countries, the basic principles behind the tests remain similar and
are based on the original work of Bauer and colleagues (Kirby–Bauer method). Some techniques employ a control bacterial isolate on each plate so that comparisons between
zone sizes around
the test and control bacterium can be ascertained (i.e. a disc potency
control). Provided
that discs are maintained and handled
as recommended by the manufacturer, the value of such
controls becomes debatable and probably unnecessary. Control strains of bacteria are available which should
have inhibition zones
of a given diameter with
stipulated antimicrobial discs. Use of such controls
endorses the suitability of the methods (e.g. medium,
inoculum density,
incubation conditions) employed. For slow growing microorganisms, the incubation period can be extended. Problems arise with disc tests where the inoculum density is inappropriate (e.g.
too low, resulting in an
indistinct edge to the inhibition zone following incubation), or where the edge is obscured
by the sporadic growth of cells within the inhibition zone,
i.e. the initial inoculum although pure contains cells
expressing varying
levels of susceptibility—so-called heterogeneity.
As the distance from the disc increases, there is a logarithmic
reduction in the antimicrobial concentration; the result is that
small differences in zone diameter with antimicrobials (e.g. vancomycin) which diffuse poorly through solid media may represent significantly different
MICs. Possible synergistic or antagonistic combinations of antimicrobials can often be detected using disc tests (Figure 18.4).
ii) Dilution tests
These usually
employ liquid media
but can be modified
to involve solid
media. Doubling dilutions, usually in the range 0.008–256 mg/L
of the antimicrobial under test,
are prepared in a suitable
broth medium, and a volume
of log-phase cells
is added to each dilution
to result in a final cell density of around 5 × 10⁵ CFU/ml. After incubation at 35°C for 18 hours, the concentration of antimicrobial
contained in the first clear tube is read as the MIC.
Needless to say, dilution tests
require a number
of controls, e.g. sterility control, growth control,
and the simultaneous testing of a bacterial strain with known
MIC to show that the dilution
series is correct.
Endpoints with dilution tests are usually sharp and easily
defined, although ‘skipped’ wells (inhibition in a well with growth either side) and ‘trailing’ (a gradual reduction in growth over a series of wells) may be encountered. The latter is especially evident with antifungal tests (see below). Nowadays, the dilution test for established antimicrobials has been simplified by the commercial availability of 96well micro titre plates which have appropriate
antimicrobial dilutions frozen or lyophilized onto wells in the plate. The appropriate antibacterial suspension (in
200–400 μl volumes) is simply
added to each
well, the plate
is incubated as before,
and the MIC is read.
Dilution tests
can also be carried out
using a series
of agar plates
containing known antimicrobial concentrations. Appropriate bacterial
suspensions are inoculated on to each plate and the presence
or absence of growth
is recorded after
suitable incubation. Most clinical laboratories now employ agar dilution breakpoint
testing methods. These are
essentially truncated agar
dilution MIC tests employing only a small
range of antimicrobial concentrations around the critical
susceptible/resistant cut-off levels. Many automated
identification and sensitivity testing machines
now use a liquid (broth)
variant of the agar breakpoint procedure. Similar breakpoint antimicrobial
concentrations are used with the presence
or absence
of growth being
recorded by some
automated procedure (e.g. light-scattering, colour change) after a
suitable incubation period.
iii)
E-tests
Perhaps the most convenient
and presently accepted method of determining bacterial MICs, however, is the E (Epsilometer)-test. The concept and
execution of the E-test is similar
to the disc diffusion test except that a
linear gradient of lyophilized antimicrobial in twofold dilutions on nylon
carrier strips on one side
are used instead of the filter-paper impregnated
antimicrobial discs. On the other side of the nylon strip
are a series of lines and figures denoting MIC values (Figure
18.5). The nylon strips are placed antimicrobial side down on the
freshly prepared
bacterial lawn and, after incubation, the MIC is determined by noting where the ellipsoid (pearshaped) inhibition zone crosses the strip (Figure
18.5).
For most
microorganisms, there appears
to be excellent correlation between dilution and E-test MIC
results. As with standard disc
diffusion tests, resistant strains may be isolated from within the zone of inhibition.
iv) Problematic bacteria
With
some of the emerging
antimicrobial-resistant bacterial pathogens, e.g. vancomycin-resistant enterococci (VRE), meticillin-resistant Staph. aureus
(MRSA), vancomycin-intermediate Staph.
aureus (VISA), the standard methodology described
above may fail to detect the resistant phenotype. This is due to a variety of factors
including heterogeneous expression of resistance (e.g. MRSA, VISA), poor agar diffusion of
the antimicrobial (e.g. vancomycin) and slow growth
of resistant cells
(e.g. VISA). Disc tests
are unsuitable for VRE, which should
have MICs determined by E-test or dilution techniques. With MRSA, a heavier
inoculum should be used in tests
and 2–4% additional salt (NaCl)
included in the medium
with incubation for a full 48 hours.
Reducing the incubation temperature to 30 °C may also facilitate detection of the true MIC value. Although 100% of MRSA cells may contain resistance genes, the
phenotype may only be evident in a small percentage of cells under the usual conditions employed in sensitivity tests. Expression is enhanced at lower temperatures and at higher
salt concentrations. With VISA, MIC determinations require incubation
for a full 24 hours
or more because
of the slower growth rate of resistant cells.
b) Tests For Bactericidal Activity
MBC testing is required
for the evaluation of novel antimicrobials. The MBC
is the lowest concentration (in mg/L) of antimicrobial that results in 99.9% or more
killing of the bacterium under test. The 99.9% cut-off
is an arbitrary in vitro
value with 95%
confidence limits that has uncertain
clinical relevance. MBCs are determined by spreading 0.1 ml (100 μl) volumes
of all clear (no growth) tubes
from a dilution MIC test
onto separate agar plates (residual antimicrobial in the 0.1 ml sample is ‘diluted’ out over
the plate). After
incubation at 35 °C
overnight (or longer for slow-growing bacteria), the numbers of colonies growing
on each plate
are recorded.
The first
concentration of drug
that produces <50
colonies after
subculture is considered the MBC. This is based on the fact
that with MICs,
the initial bacterial inoculum should result in about 5 × 10⁵ CFU/ml. Inhibition, but not killing of this inoculum,
should therefore result in the growth of 50 000 bacteria
from the 0.1 ml sample.
A 99.9% (3-log)
kill would result
in no more than 50 colonies on the subculture plate. With most modern antibacterial drugs,
the concentration that
inhibits growth is very
close to the concentration that
produces death, e.g. within
one or two dilutions. In general, only
MICs are determined for such drugs.
c) Tests For Fungistatic And Fungicidal Activity
As fungi
have become more prominent human pathogens, techniques for investigating the susceptibility of isolates to the growing number
of antifungal agents
have been developed. These have been largely based on the established bacterial techniques (disc,
dilution, E-test) mentioned above, with the proviso
that the medium
used is different (e.g. use of RPMI 1640
plus 2% dextrose) and that the inoculum
density (yeast cells
or spores) used is
reduced (c.104 CFU/ml). With yeast disc and E-tests,
a lawn producing just
separated/distinct colonies is preferable to confluent growth (see Figure
18.5). Addition of methylene blue (0.5 mg/ml)
to media may improve the clarity of inhibition zone edges. Problems
of ‘tailing’ or ‘trailing’ in dilution tests,
and indistinct inhibition zone edges are often
seen in tests
involving azoles and yeasts
and appear in some way related to the type of buffer employed in the growth
medium. However,
their presence has prompted
studies into evaluating the use of other techniques as an indicator of significant fungistasis.
e.g. 50% reduction in growth (rather
than complete inhibition) as the end point,
use of a dye (e.g.
Alamar blue) colour change to indicate growth,
and sterol (ergosterol) quantitation. Most of these
are presently outside the scope of most routine laboratories.
As with MBC estimations, MFC evaluation is an extension of the MIC test.
At the completion of the MIC test
(e.g. 72 hours for filamentous fungi),
20 ml are sub-cultured on to a suitable
growth medium from each optically clear microtitre tray
well and the growth control
well. These plates
are then incubated at 35 °C until growth
is evident on the growth control
subculture (24–48 hours). The MFC is the lowest drug concentration showing
no growth or fewer than three colonies per plate to obtain
approximately 99–99.5%
killing activity.
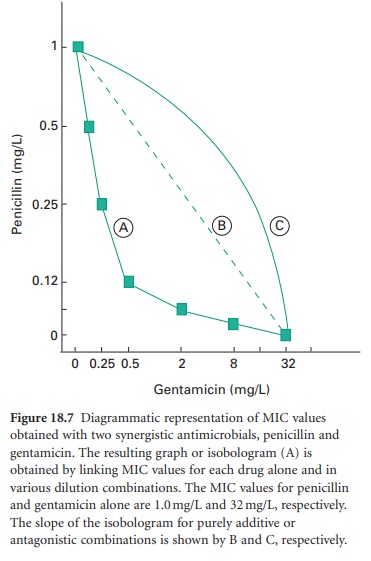
d) Evaluation Of Possible Synergistic Antimicrobial Combinations
The potential interaction between two antimicrobials can be demonstrated using a variety of laboratory
procedures, e.g. ‘chequerboard’ MIC assays where the microorganism is exposed to varying dilutions of each drug alone
and in combination, disc diffusion
tests (see Figure
18.4) and kinetic kill curve assays.
With the former, results
can be plotted
in the form of a figure called
an isobologram (see Figure 18.7).
i) Kinetic Kill Curves
In the case of kill curves,
the microorganism is inoculated
into tubes containing a single concentration of each antimicrobial alone, the same concentrations of each antimicrobial in combination, and no antimicrobial i.e. four tubes. All tubes
are then incubated and viable counts
are performed at regular
intervals on each
system. With results
plotted on semilogarithmic paper,
synergy is defined
as a greater than 100-fold increase in killing
of the combination compared with either drug
alone. Antagonism is defined as at least a 100-fold decrease
in killing of the
combination when compared
with the most
active agent alone, while
an additive or autonomous combined effect results in a less than
10-fold change from
that seen with the most active
single drug. Both
chemotherapeutic agents and disinfectants are amenable to kill curve
assays.
Related Topics
