Results
| Home | | Pharmacovigilance |Chapter: Pharmacovigilance: PEM in the UK
Data analysis in PEM utilises several approaches which combine the application of epidemiological methods with medical evaluation.
RESULTS
Data
analysis in PEM utilises several approaches which combine the application of
epidemiological methods with medical evaluation.
INCIDENCE DENSITIES
Since
most adverse drug reactions are the so-called ‘type A’ reactions, which are
caused by the pharmacological effects of the product, and commonly occur within
a short period after exposure, comparing the rates of events occurring soon
after exposure with subsequent periods provides a useful means to generate
possible drug safety signals.
PEM
provides a numerator (the number of reports) and a denominator (the number of
patient-months or patient-weeks of
exposure), both collected within a known time frame (the difference, for each
patient, between the start and stop dates of the drug being monitored).
The
incidence density (ID) for a given time period, t, for each of the event terms
in the DSRU dictionary is calculated as follows:
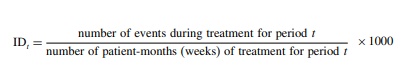
IDt
= [ number of events during treatment for period t / number of patient-months
(weeks) of treatment for period t ] ×1000
The
IDs per 1000 patient-months (or patient-weeks) of treatment are then ranked to
give estimates of the ‘real-world’ frequency of reported events.
While
events with higher incidence densities in the period after exposure compared
with subsequent periods are considered safety signals for the product under
study, such events may be due to the effects of a product taken before the drug
under study was started. For example,
cough occurring soon after starting an angiotensin-II (A-II) receptor antagonist
(e.g. losartan) may have been caused by an angiotensin-converting enzyme
inhibitor taken before starting the A-II antagonist.
REASONS FOR STOPPING
The
green form asks the doctor to specify the ‘Reason for stopping’ the drug being
monitored if treatment was stopped. Thus, the ranked ‘Reasons for stopping’ (in
terms of the number of reports of each event) is another source for generating
signals and can be compared with the ranked IDs for the first month of therapy
in each individual patient. As examples, data for the most frequently reported events
with the two anti-epileptic drugs, lamotrigine and vigabatrin, are given in
Table 24.3.
In
general, there appears to be a high degree of correlation between these two
sets of values. These values can be used to compare drugs within one
ther-apeutic class: for example with anti-epileptic drugs it shows that rash is
the most frequently reported event likely to be a drug side effect with
lamotrigine, whereas rash is far less common with vigabatrin; simi-larly,
respiratory tract infection (which occurs month in and month out in all cohorts
and which is, with many drugs, unlikely to be related to either the drug or
disease being treated) is fairly common among the ID values but virtually never
appears among the common reasons for drug withdrawal.
GENERATION AND EXPLORATION OF SIGNALS
Signals
are generated by an event having an unusually high ID or ranking in the list of
‘Reasons for stop-ping’ the drug being monitored or being considered medically
important by the Research Fellow. While comparisons of incidence densities
nearly always utilise the differences between the incidence density in the
first month and subsequent months, it has been possible to use the difference
between incidence densities in month 6 with months 1–5 in a 6-month study to
generate signals for delayed adverse reac-tions such as gynaecomastia with
finasteride (Wilton et al., 1996), a
product used for benign prostatic hypertrophy.
Many
signals have been generated in PEM, exam-ples include visual field defects in
patients taking vigabatrin (Wilton et al.,
1999), gastrointestinal intol-erance due to acarbose (Mackay et al., 1997a), oesophageal reactions
with alendronate (Mackay et al.,
1997b), aggression, agitation and abnormal
dreams with donepezil (Dunn et al.,
2000), diarrhoea in the elderly with lansoprazole (Martin et al., 2000), and serotonin syndrome with antidepressants (Mackay et al., 1999).
FOLLOW-UP OF IMPORTANT EVENTS
Analysis
and evaluation of pharmacoepidemiologi-cal data should include medical
assessment, both to improve the understanding of signals raised by
epidemiological techniques and to raise (and evaluate) new signals or
hypotheses by using medical judge-ment with appropriate systems for causal
inference.
Medical
evaluation of individual case reports and clusters of reports is an important
part of PEM. Impor-tant safety signals have been generated in this way. In the
PEM study of the antiepileptic drug vigaba-trin, following published case
reports of visual field defects associated with the use of the product, four
cases of visual field defects were identified initially in the PEM cohort. In
view of the importance of the signal, 7228 patients who were reported to be
taking the product by the end of the study were followed up by sending a simple
questionnaire to the GP to ask whether any serious adverse events or changes in
vision had been reported since the initial green form had been returned. In
addition, if the patient has been seen by an ophthalmologist for visual
problems, the ophthalmologist was asked to complete a ques-tionnaire giving
details of visual field testing before and during treatment with vigabatrin.
The follow-up information revealed an additional 29 cases of visual field
defects which were considered by the ophthal-mologist to be probably or
possibly related to viga-batrin, giving an incidence of risk of 7.00 per 1000
patients (Wilton et al., 1999). The
follow-up exercise in the PEM study of vigabatrin contributed to the
understanding of this important adverse reaction and provided a method to
compute the reported rate of the adverse reaction in real clinical use which
was not possible with spontaneous reporting or in clinical trials.
THE OUTCOME OF EXPOSED PREGNANCIES
All
pregnancies reported during PEM studies are followed up by the medical and
scientific staff of the DSRU in order to determine the outcome in those babies
exposed during pregnancy to the drugs being monitored.
A
review (Wilton et al., 1997) showed
that 2508 pregnancies have been followed up in 34 PEM studies. The study drug
was known to have been dispensed during 904 of these pregnancies (839 during
the first trimester and 65 during the second/third trimesters). The first
trimester pregnancies produced 553 live births among which 20 (3.6%)
abnormal-ities were reported. The findings are little different from the
proportion of abnormalities reported in the general population in the United
Kingdom. Thus, these observational data may be of value to those who need to
advise pregnant women exposed to newly marketed medicines. The pregnancy
database of PEM is expanding. Moreover, the DSRU is currently analysing the
pregnancy exposure data with the appli-cation of comparative statistical
methods between products in the PEM database or with external data, e.g.
national statistics of congenital abnormalities, and the results will be
published in due course.
LONG LATENCY ADVERSE REACTIONS
Delayed
reactions can be investigated by sending out further green forms relating to
those patients shown in the initial PEM survey to be receiving long-term
medication. One such study has provided reassuring data on the safety of
long-term use of lamotrigine in epilepsy (MacKay et al., 1997c).
COMPARING DRUGS IN THE SAME THERAPEUTIC CLASS
The
size of the PEM database (78 completed stud-ies with a total of one million
patients) and advances in information technology are providing increasing
opportunities to compare the safety profiles of prod-ucts in the same
therapeutic class. In the last few years many comparative studies (Table 24.4)
have been conducted using PEM data which contributed to the understanding of
the safety of many products.
Comparisons in PEM have included the appli-cation of nested case–control methodology (Dunn et al., 1999). Nested case–control design appears to have useful applications to PEM and will be applied increasingly in the future. Another method that is currently being developed for signal generation in PEM is the routine application of comparative report-ing rates for reported events in PEM.
INVESTIGATION OF SAFETY SIGNALS FROM OTHER SOURCES
The
DSRU monitors the literature and the World Wide Web for important drug safety
signals gener-ated elsewhere, particularly those that cause public health or
regulatory concerns. The Unit also receives requests from regulatory
authorities and manufactur-ers to investigate drug safety signals in the PEM
database. Whenever possible the DSRU conducts retrospective analyses (which
usually include follow-up of reports for the drug in question and compara-tor
drugs). Such analyses contribute to the debates on these signals and to
regulatory and public health decisions.
One
example is the study on sertindole (Wilton et
al., 2001). Sertindole is an atypical antipsychotic known to be associated with prolongation of the QTc interval. The
product was withdrawn from markets in the European Union following reports of
sudden death and serious cardiac arrhythmias. The compara-tive analyses of the
PEM studies of sertindole and two other atypical antipsychotics, risperidone
and olanzap-ine, studied cardiovascular events, deaths from cardio-vascular
events as well as deaths from other causes such as suicide. The report of the
comparative anal-ysis was considered to be a very important source of
information for the regulatory decision on the matter.
Another
example of a retrospective analysis of a PEM study is the analysis conducted on
the associa-tion between selective serotonin re-uptake inhibitors (SSRIs) and
bleeding, which showed a possible weak association (Layton et al., 2001).
While
such comparisons produce valuable additions to the understanding of the safety
of medicines, it is important to emphasise that comparisons of inde-pendent
cohorts are subject to bias and confounding, which must be taken into consideration
in the anal-ysis and evaluation process. However, the paucity of post-marketing
safety studies in large populations makes the information provided by these
compara-tive studies very useful. Real benefit can only be achieved when not
only the limitations of any post-marketing safety study are taken into
consideration but when its results are considered in relation to other studies
that had been conducted on the same product.
COMPARISON WITH NATIONAL DATA
Where
appropriate, comparisons are made between event rates in PEM studies and other
data resources, e.g. national statistics. An example is the analysis of
cardiovascular events of the PEM study on silde-nafil (a product used for
erectile dysfunction) (Shakir et al.,
2001). Reported deaths from myocardial infarc-tion and ischaemic heart disease
in users of sildenafil in the PEM study were found to be no higher than
expected according to national mortality statistics. The precautions with
regard to possible sources of bias and confounding also apply to external
comparisons.
Related Topics
