The Power Function
| Home | | Advanced Mathematics |Chapter: Biostatistics for the Health Sciences: Tests of Hypotheses
The power function depends on the significance level of a test and the sampling distribution of the test statistic under the alternative values of the population parameters.
THE POWER FUNCTION
The power function depends on the significance
level of a test and the sampling distribution of the test statistic under the
alternative values of the population parameters. For example, when a Z or t
statistic is used to test the hypothesis (H0)
that the population mean μ equals μ0, the power function equals α at μ1 = μ0 and increases as moves away from μ0. The power function approaches 1 as μ1 gets very far from μ0. Figure 9.1 shows a plot of the power function for a population mean in
the
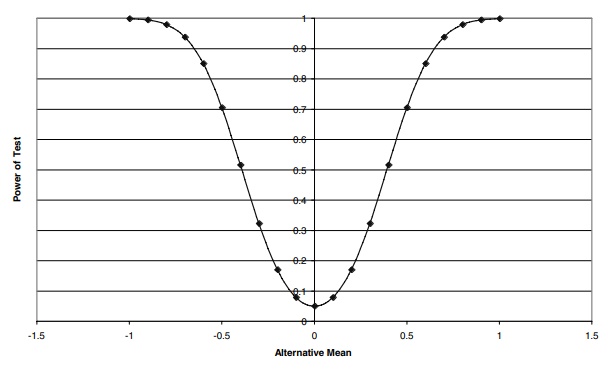
Figure 9.1. Power function for a test that a
normal population has mean zero versus a two-sided alterna-tive when the sample
size n = 25 and the significance level α = 0.05.
In this case, Z = (![]() – μ1)/ ( σ/√n) = (
– μ1)/ ( σ/√n) = (![]() – μ1)/( σ/5) = 5(
– μ1)/( σ/5) = 5(![]() – μ1)/σ and Z has a standard normal
distribution. This distribution depends on μ1 and σ. We know the value of σ and can take σ = 1, recognizing that although the power depends on μ1 for the curve in Figure 9.1, to be more general we
would replace μ1 with μ1/σ for other values of σ. The power is the probability of
observing Z in the acceptance region
that is P(–C < Z < C), where C is the critical value; consequently, the power depends on the
sample size and signif-icance level through C
as well as the sample size n through
the formula for Z.
– μ1)/σ and Z has a standard normal
distribution. This distribution depends on μ1 and σ. We know the value of σ and can take σ = 1, recognizing that although the power depends on μ1 for the curve in Figure 9.1, to be more general we
would replace μ1 with μ1/σ for other values of σ. The power is the probability of
observing Z in the acceptance region
that is P(–C < Z < C), where C is the critical value; consequently, the power depends on the
sample size and signif-icance level through C
as well as the sample size n through
the formula for Z.
Figure 9.2 displays, on the same graph used for n = 25, the comparable results for a
sample size n = 100. We see how the
power function changes with increased sample size.
Related Topics
