Sensitivity and Specificity in Medical Diagnosis
| Home | | Advanced Mathematics |Chapter: Biostatistics for the Health Sciences: Tests of Hypotheses
Screening tests are used to identify patients who should be referred for diagnostic evaluation.
SENSITIVITY AND SPECIFICITY IN MEDICAL DIAGNOSIS
Screening tests are used to identify patients who
should be referred for diagnostic evaluation. The validity of screening tests
is evaluated by comparing their screening results with those obtained from a
“gold standard.” The gold standard is the defini-tive diagnosis for the
disease. However, it should be noted that screening is not the same thing as
diagnosis; it is a method applied to a population of apparently healthy
individuals in order to identify those who may have unrecognized or subclinical
conditions. In designing a screening test, physicians need to identify a
particular cutoff measurement from a set of measurements in order to
discriminate between healthy and “diseased” persons.
These measurements for healthy individuals can have
a range of normal values that overlap with values for patients having the
disease. Also, the very nature of measurement leads to some amount of error.
For some illnesses, there is no ideal screening measure that perfectly
discriminates between the patients who are free from disease and those with the
disease. As a result, there is a possibility that the screening test will
classify a patient with a disease as normal and a patient without the disease
as having the disease.
An example is blood glucose screening test for
diabetes. Blood sugar measure-ments for diabetic and normal persons form two
overlapping curves. Some high normal blood sugar values overlap the lower end
of the distribution for diabetic pa-tients. If we declare that a blood glucose
value of 120 should form the cutoff be-tween normal and diabetic persons, we
will unwittingly include a few nondiabetic persons with diabetic individuals.
If we formulated the screening test as a
statistical hypothesis testing problem, we would see that these two types of
error could be the type I and type II errors for the hypothesis test. In
medical diagnosis, however, we use special terminology. Refer to Table 9.4 and
the discussion that follows the table for the definitions of these terms.
Suppose we applied a screening test to n
patients and out of the n patients
ob
TABLE 9.4. Sensitivity and Specificity in Diagnostic Testing
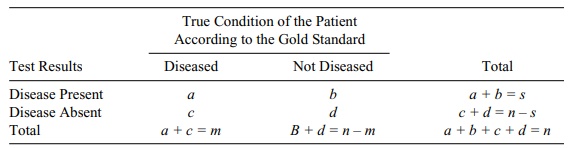
The test screens s of the patients as positive
(indicat-ing the presence of the disease) and n – s as negative (indicating the absence of the disease). In
reality, if we knew the truth (according to the gold standard or other-wise),
there are m patients with the disease
and n – m patients without the
disease.
The s
patients diagnosed with the disease include a
patients who actually have it and b
patients who do not. So s = a + b. Now, of the m patients who actually have the disease, a were diagnosed with it from the test and c were not. So m = a
+ c. This leaves d patients who
do not have the disease and are diagnosed as not having it. So d = n
– s – c = n – s – m + a. The results are summarized in Table 9.4.
The off-diagonal terms b and c represent the
number of “false positives” and “false negatives,” respectively. The ratio b/n
is an estimate of the probability of a false positive, and c/n is an estimate of the
probability of a false negative.
Also of interest are the conditional error rates,
estimated by b/(n – m) = b/(b + d) and c/m = c/(c
+ a), which represent, respectively,
the conditional probability of a positive test result given that the patient
does not have the disease and the condition-al probability of a negative test
result given that the patient does have the disease.
Related to these conditional error rates are the
conditional rates of correct classi-fication known as specificity and
sensitivity, the definitions of which follow.
Sensitivity is the probability that the
screening test identifies the patient as hav-ing the disease (a positive test
result) given that he or she does in fact have the dis-ease. The name comes
about because a test that has a high probability of correct de-tection is
thought to be highly sensitive. An estimate of sensitivity from Table 9.4 is a/(a
+ c) = 1 – c/(a + c) = 1 – c/m. This is 1 minus the
conditional probability of a false
positive.
Specificity is the probability that a
screening test declares the patient well (a neg-ative test result), given that
he or she does not have the disease. From Table 9.4, specificity is estimated
by d/(b + d) = 1 – b/(b + d) = 1 – b/(n – m). This is 1
minus the conditional probability of a false negative.
Ideally, a screening test should have high sensitivity
and high specificity; i.e., the specificity and the sensitivity should be as
close to 1 as possible. However, mea-surement error and imperfect
discriminators make it impossible for either value to be 1. Recall that in
hypothesis testing if we are given the test statistic for a fixed sample size,
we can change the type I error by changing the cutoff value that deter-mines
the critical region. But any change that decreases the type I error will
in-crease the type II error, so we have a trade-off between the two error
rates. The same trade-off is true regarding the conditional error rates;
consequently, increas-ing sensitivity will decrease specificity and vice versa.
For a further discussion of screening tests, consult Friis and Sellers (1999).
Related Topics
