Two-Sample t Test (Independent Samples with a Common Variance)
| Home | | Advanced Mathematics |Chapter: Biostatistics for the Health Sciences: Tests of Hypotheses
Power function for a test that a normal population has mean zero versus a two-sided alternative
TWO-SAMPLE t TEST (INDEPENDENT
SAMPLES WITH A COMMON VARIANCE)
Recall from Section 8.5 the use of the appropriate t statistic for a confidence interval
under the following circumstances: the parent populations have normal distribu
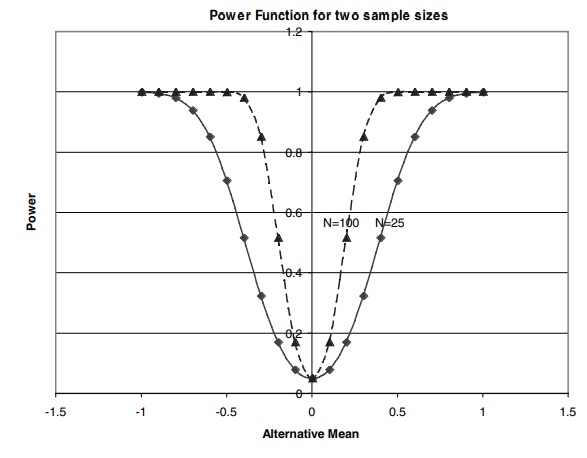
Figure 9.2. Power function for a test that a normal population has mean zero versus a two-sided alternative when the sample size n = 25, n = 100, and the significance level α = 0.05.
Suppose we want to evaluate whether the means of
two independent samples selected from two parent populations are significantly
different. We will use a t test with sp2 as the pooled
variance estimate. The corresponding t
statistic is t =  .
The formula for t is obtained by
replacing the common in the formula for the two sample Z test with the pooled estimate Sp.
The resulting statistic has Student’s t
distribution with nt + nc – 2 degrees of freedom.
This sample t statistic is used for
hypothesis testing. For a two-sided test the steps are as follows:
.
The formula for t is obtained by
replacing the common in the formula for the two sample Z test with the pooled estimate Sp.
The resulting statistic has Student’s t
distribution with nt + nc – 2 degrees of freedom.
This sample t statistic is used for
hypothesis testing. For a two-sided test the steps are as follows:
1. State the null hypothesis H0: μt = μc versus the alternative hypothesis H1:
μt
≠
μc.
2. Choose a significance level α= α0 (often we take α0 = 0.05 or 0.01).
3. Determine the critical region,
that is, the region of values of t in
the upper and lower α/2 tails of the sampling
distribution for Student’s t
distribution with nt + nc – 2 degrees of freedom
when μt = μc (i.e., the sampling distribution when the null hypothesis is true).
4. Compute the t statistic: for the given sample
and sample sizes nt and nc, where Xt is the sample mean for the
treatment group, ![]() c
is the sample mean for the control group, and Sp is the pooled sample standard deviation.
c
is the sample mean for the control group, and Sp is the pooled sample standard deviation.
5. Reject the null hypothesis if
the test statistic t (computed in
step 4) falls in the rejection region for this test; otherwise, do not reject
the null hypothesis.
We will apply these steps to the pig blood loss
data from Section 8.7, Table 8.1. Recall that Sp2 = {S2t(nt – 1) + Sc2(nc – 1)}/[nt + nc – 2] = {(717.12)2 9 + (1824.27)2
9}/18, since nt = nc = 10, St = 717.12, and Sc
= 1824.27. So Sp2
= 2178241.61 and taking the square root we find Sp = 1475.89. As the degrees of freedom are nt + nc – 2 = 18, we find that the constant C from the table of the Student’s t distribution is 2.101. Applying steps
1–5 to the pig blood loss data for a two-tailed (two-sided) test, we have:
1. State the null hypothesis H0: μt = μc versus the alternative hypothesis H1:
μt ≠
μc.
2. Choose a significance level α = α0 = 0.05.
3. Determine the critical region,
that is, the region of values of t in
the upper and lower 0.025 tails of the sampling distribution for Student’s t distribution with 18 degrees of
freedom when μt/μc (i.e., the sampling distribution when the null hypothesis is true).
4. Compute the t
statistic: We are given that the sample sizes are nt
= 10 and nc = 10, respectively.
Under the null hypothesis, μt – μc = 0 and ![]() t
– Xc = 1085.9–2187.4 =
–1101.5 and sp, the pooled
sample standard deviation, is 1475.89. Since √{(1/nt) + (1/nc)]} = √(2/20) = √0.1 = 0.316, t =
–1101.5/(1475.89)0.316 = –2.362.
t
– Xc = 1085.9–2187.4 =
–1101.5 and sp, the pooled
sample standard deviation, is 1475.89. Since √{(1/nt) + (1/nc)]} = √(2/20) = √0.1 = 0.316, t =
–1101.5/(1475.89)0.316 = –2.362.
5. Now, since –2.362 < –C = –2.101, we reject H0.
Related Topics
