Spearman’s Rank-Order Correlation Coefficient
| Home | | Advanced Mathematics |Chapter: Biostatistics for the Health Sciences: Nonparametric Methods
Statistical significance tests for a nonzero correlation were derived when X and Y can be assumed to have a bivariate normal distribution.
SPEARMAN’S RANK-ORDER CORRELATION COEFFICIENT
In Section 12.4, we introduced the Pearson product
moment correlation between two random variables X and Y. Recall that the
Pearson correlation coefficient is a measure of the degree of the linear
relationship between X and Y. Statistical significance tests for a
nonzero correlation were derived when X
and Y can be assumed to have a
bivariate normal distribution. We also saw that if X and Y are functionally
related in a nonlinear way, the absolute value of the correlation would be less
than 1. For example, a nonlinear functional relationship might be Y = X2.
In this case, if we looked at values in the range on X between zero and 1, we would find a positive cor-relation that is
less than 1. Looking at the interval between –1 and zero, we would find a
negative correlation between zero and –1.
Now we will measure correlation in a more general
way that satisfies two conditions. (1) X
and Y are allowed to have any joint
distribution and not necessarily the bivariate normal distribution. (2) The
correlation between X and Y will have the property that as X increases Y increases (or decreases), then the correlation measure will be +1
(or –1). In this case if Y = ln(X) for X > 1 or Y = X2 for X > 0, then the correlation between Y and X will be +1 since Y never decreases as X increases over the range of
permissible values. Similarly, if Y =
exp(–X) for X > 0, then Y and X will have correlation equal to –1.
Statisticians have derived nonparametric mea-sures of correlation that exhibit
the foregoing two properties. Two examples are Spearman’s rho (ρsp), attributed to Spearman (1904),
and Kendall’s tau (τ), intro-duced in Kendall (1938). Both of these measures have been shown
to satisfy conditions (1) and (2) above.
In this text, we will discuss only Spearman’s rho,
which is very commonly used and easy to describe. Rho is derived as follows:
1. Separately rank the
measurements (Xi, Yi) for the Xs and Ys in increasing order.
2. Replace the pair (Xi, Yi) for each i
with its rank pair (i.e., if Xi
has rank 4 and Yi rank 7,
the transformation replaces the pair with the rank pair (4, 7).
3. Apply the formula for Pearson’s product moment
correlation to the rank pairs instead of to the original pairs. The result is
Spearman’s rho.
Spearman’s rho enjoys the property that all of its
values lie between –1 and 1. This result obtains because rho is the Pearson
correlation formula applied to ranks. If Y
is a monotonically increasing function of X
(i.e., as X increases, Y increases), then the rank of Xi will match the rank of Yi. This relationship means
that the ranked pairs will be (1, 1), (2, 2), (3, 3), . . . , (n, n).
A scatter plot would show these points falling
perfectly on a 45° line in a plane. Recall that for Pearson’s correlation
formula, a perfect linear relationship with a positive slope gives a
correlation coefficient of 1. So if Y
is a monotoni-cally increasing function of X,
the Spearman correlation coefficient (rho) between X and Y is 1. Similarly,
one can argue that if Y is a
monotonically decreasing func-tion of X,
the rank pairs will be (1, n), (2, n – 1), (3, n – 2), . . . , (n – 1,
2), (n, 1). The smallest value of X corresponds to the largest value of Y. Consider the exam-ple Y = exp(–X) with values at X = 1,
1.5, 2, 2.5, and 3. The number of pairs is n
= 5 and these pairs are [X, exp(–X)], which equal (1, 0.368), (1.5,
0.223), (2, 0.135), (2.5, 0.082), and
(3, 0.050) where we have rounded exp(–X)
to three decimal places. Note that the ranks for the Xs are 1 for 1, 2 for 1.5, 3 for 2, 4 for 2.5, and 5 for 3. The
corresponding Ys have ranks 5 for
0.368, 4 for 0.223, 3 for 0.135, 2 for 0.082, and 1 for 0.050. So the pairs are
(1, 5), (2, 4), (3, 3), (4, 2) and (5, 1). A scatter plot of such pairs would
show that these rank pairs fall perfectly on a line with a slope of –1. Hence,
the Spearman correlation coefficient in this case is –1.
The computational formula for Spearman’s rank
correlation rho with ties is given by Equation 14.7:
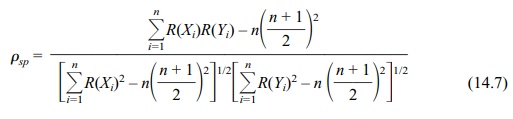
where n
is the number of ranked pairs, R(Xi) is the rank of Xi, and R(Yi) is the
rank
of Yi.
When there are no ties, the formula in Equation
14.7 simplifies to Equation 14.8:
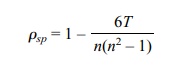
where T =
Σin=1[R(Xi) – R(Yi)]2,
n is the number of ranked pairs, R(Xi)
is the rank of Xi, and R(Yi)
is the rank of Yi.
To illustrate the use of the foregoing equations,
we will compute the Spearman rank correlation coefficient between temperatures
paired by date and for the twins’ aggressiveness scores paired by birth order
of the siblings. Table 14.11 illustrates the computation for the temperatures..
Since there are no ties in rank, we can use Equation 14.8. The term in the last
column of Table 14.11 is the ith term
in the sum (Σ[R(Xi) – R(Yi)]2).
TABLE 14.11. Daily Temperature Comparison for Two Cities
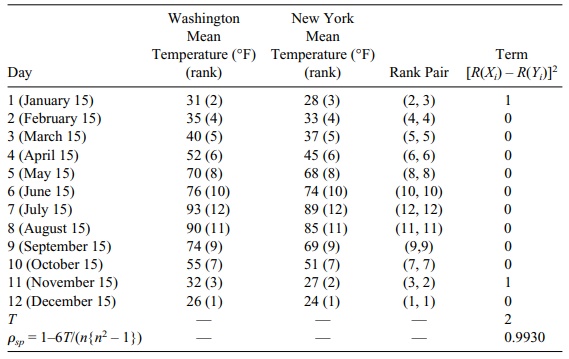
Table 14.12 provides the same calculations for the
twins. As there are a few ties in this case, we cannot use Equation 14.8 but
instead must use Equation 14.7.
Related Topics
