Survival Probabilities
| Home | | Advanced Mathematics |Chapter: Biostatistics for the Health Sciences: Analysis of Survival Times
Suppose we would like to estimate the survival of patients who are about to undergo a clinical procedure.
SURVIVAL PROBABILITIES
Introduction
Suppose we would like to estimate the survival of
patients who are about to undergo a clinical procedure. From an existing set of
survival and censoring times observed from patients who already have been in a
clinical trial, we can estimate survival of new patients about to experience
the procedure. For example, to accomplish this ex-trapolation, we could look at
the survival history of patients with implanted defibril-lators. We could try
to predict the probability that a new patient planning to undergo the same
implant procedure would survive for a specified length of time.
Sometimes, researchers are interested in a
particular time interval, such as sur-viving for another five years (a common
survival time). But often the time interval is the whole curve, which
represents survival for x months or
more, for 0 < x < L, where L is some period (usually L
is less than or equal to the length of the study, but if parametric methods are
used, L can be longer). Altman (1991)
provides an exam-ple of data expressed as survival time in months. (Refer to
Table 15.1.)
The methods for predicting survival times are
clever and account for the fact that some cases are censored. Researchers
portray survival data in graphs or tables called life tables, survival curves,
or Kaplan–Meier curves (described in detail in the next sections).
We will define the survival function and present
ways of estimating it. Let S(t) denote the survival function. S(t)
= P(X > t), where X is the survival time for a ran-domly
selected patient. S(t) represents the probability that a
typically selected pa-tient would survive a period of t units of time after entry into the study (generally after
receiving the treatment). The methods described in Sections 15.2.2 and 15.2.3
use data similar to those given in Table 15.1 to estimate the survival curve S(t)
at various times t.
TABLE 15.1. Survival Times for Patients
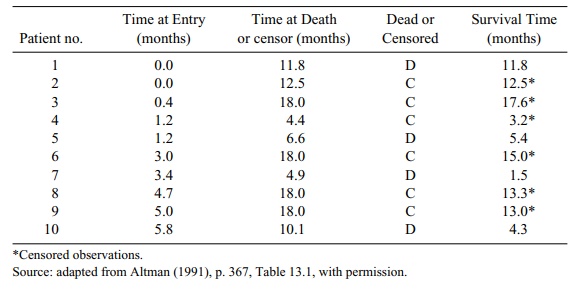
We notice from Table 15.1 that patients are accrued
during the first six months of the study. We infer this from the fact that the
last (10th) patient was entered at 5.8 months into the study. Patients are then
followed until the 18th month, when the trial is terminated. Note that the
maximum time at death or censoring is 18 months.
Four patients died during the trial and six were
known to be living at the end of the trial or were lost to follow-up prior to
the completion of the trial. (Refer to the column labeled “Dead or Censored.”)
So the survival times for those six were cen-sored. Patients 3, 6, 8, and 9
completed the trial and were censored at the 18 month time point; patients 2
and 4 were lost to follow-up; and the remaining patients (1, 5, 7, and 10)
died.
The information in this table is all we need to
construct a life table or a paramet-ric (e.g., Weibull) or nonparametric (i.e.,
Kaplan–Meier) survival curve. In the next section, we will use the data from
Table 15.1 to illustrate how to construct a life table.
Related Topics
