Hypothesis Test for a Single Binomial Proportion
| Home | | Advanced Mathematics |Chapter: Biostatistics for the Health Sciences: Inferences Regarding Proportions
To test the hypothesis that the parameter p of a binomial distribution equals a hypothesized value p0, versus the alternative that it differs from p0, we can use the approximate normal quantities.
HYPOTHESIS TEST FOR A SINGLE BINOMIAL PROPORTION
To test the hypothesis that the parameter p of a binomial distribution equals a
hypothesized value p0,
versus the alternative that it differs from p0,
we can use the approximate normal quantities given in Section 10.3 either with
or without continuity correction. This statement means that we want to test the
hypothesis that the propor-tion (p)
obtained from a sample is equivalent to some hypothesized value for the
population proportion (p0).
The continuity correction is particularly important when the sample size n is small. However, exact methods are
now used instead; such methods involve computing cumulative binomial
probabilities for various values of p.
With the speed of modern computers, these calculations that used to be very lengthy can now be computed rather
rapidly.
A mathematical relationship between the integral of
a beta function and the cu-mulative binomial allows these binomial probabilities
to be calculated by a numeri-cal integration method rather than by direct
summation of the terms of the binomial distribution. The numerical integration
method is a mathematical identity that ex-presses the sum of binomial
probabilities as an integral of a particular function. The advantage of
numerical integration is that an integral can be calculated relatively quickly
by numerical methods, whereas the summation method is computationally slower.
This approach, presented by Clopper and Pearson (1934), consequently helps
speed up the computation of the binomial probabilities needed to identify the
endpoints of a confidence interval. Hahn and Meeker (1991) show how to use this
method to obtain exact binomial confidence intervals.
The test procedures that use exact methods are
always preferable to the normal ap-proximation but carry the disadvantage that
they do not have a simple form for an easy table lookup. Consequently, we have
to rely on the computer to provide us with p-values
for the hypothesis test or to compute an exact confidence interval for p.
Fortunately, though, there are relatively
inexpensive software packages such as StatXact that do this work for you.
StatXact–5, Power and Precision, UnifyPow, PASS2000, and nQuery 4.0 are
packages that will determine power or sample size re-quirements for hypothesis
tests and/or confidence intervals for binomial proportions or differences
between two binomial proportions. See Chernick and Liu (2002) for a comparison
of these products and a discussion of the peculiar saw-toothed nature of the
power function. We also discuss these packages briefly in Chapter 16.
Equation 10.3 shows the continuity-corrected test
statistic used for the normal approximation:
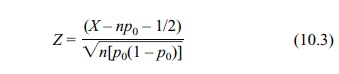
where X
is a binomial random variable with parameters n and p0.
Alternatively,
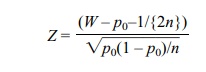
where W =
X/n.
Z has approximately a standard normal
distribution and is used in this form when approximating P(W ≤ a) or P(W
> a).
For large sample sizes, the continuity correction
is not necessary; Equation 10.4 shows the test statistic in that case:
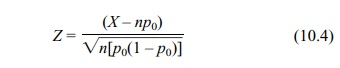
where X
is a binomial random variable with parameters n and p0.
Alternatively,
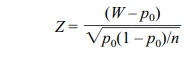
where W =
X/n.
Z has approximately a standard normal
distribution.
Here is an example of how clinical trials use
proportions. A medical device com-pany produces a catheter used to perform
ablations for fast arrhythmias called supraventricular tachycardia (SVT). In
order to show the location of cardiac electri-cal activity associated with SVT,
a map of the heart is constructed. The company has developed a new heart
mapping system that uses a catheter with a sensor on its tip. Relatively simple
ablation procedures (i.e., cutting nerve pathways) for SVT have been carried
out sufficiently often for us to know that current practice pro-duces a 95%
acute success rate. Acute success is no recurrence for a short period (usually
one or two days) before the patient is sent home. Companies also define a
parameter called chronic success, which requires that a recurrence not happen
for at least six months after the procedure. The new mapping system is expected
to pro-duce about the same success rate as that of the present procedure but
will have the advantage of quicker identification of the location to ablate
and, hence, an expected reduction in procedure time.
Most of the reduction in procedure time will be
attributed to the reduction in the so-called fluoroscopy time, the amount of
time required for checking the location of the catheter by using fluoroscopy.
Shortening this time reduces the amount of radi-ation the patient receives;
physicians and the FDA view such a reduction as a bene-fit to the patient. This
reduction in fluoroscopy time is a valid reason for marketing the new device if
the manufacturer also can show that the device is as efficacious as current
methods.
Consequently, the manufacturer decides to conduct a
clinical trial to demonstrate a reduction in fluoroscopy time. The manufacturer
also wants to demonstrate the device’s equivalence (or, more precisely, lack of
inferiority) with respect to acute success rate.
All patients will be treated with the new device
and mapping system; their suc-cess rate will be compared to the industry
standard, p0 = 0.95. (The
proportion un-der the null hypothesis will be set at 0.95.) The one-sample
binomial test described in this section will be used at the end of the trial.
Now let us consider what happened in an actual test
of the device. Equivalence testing as explained in Section 9.5 was used in the
test. The company eventually received approval for the device to treat SVT. A
slightly modified version of the device was available; the company sought
approval of it as a mapping system to treat VT (ventricular tachycardia).
Mapping procedures for VT are more compli-cated than those for SVT and have
less than a 50% chance of success. With the mapping system, the company
expected to improve the acute success rate to above 50% and also reduce
procedure time. In order to show superiority in acute success rate, they tested
the null hypothesis that p = p0 ≤ 0.50 versus the alternative that p > 0.50. We refer to this example as
a one-sided test in which we are trying to
show superiority of the new method. Later, we will see the use of a
one-sided test to show a statistically significant decrement in performance,
i.e., p = p0 ≥ .0.50
versus p < 0.50.
Related Topics
