Drug Release Patterns of Controlled Delivery Dosage Forms
| Home | | Biopharmaceutics and Pharmacokinetics |Chapter: Biopharmaceutics and Pharmacokinetics : Controlled Release Medication
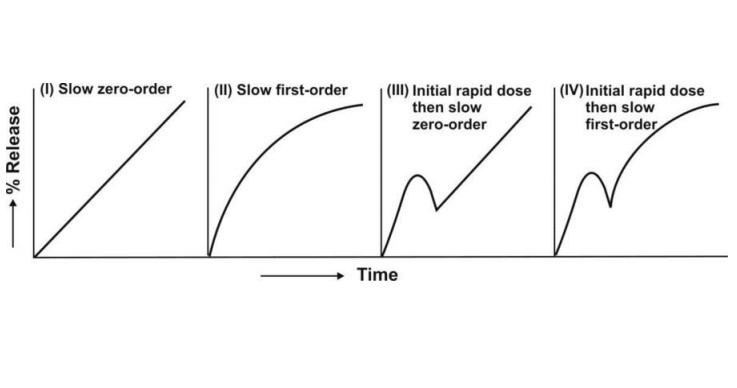
1. Slow zero-order release 2. Slow first-order release 3. Initial rapid release of loading dose followed by slow zero-order release 4. Initial rapid release of loading dose followed by slow first-order release.

DRUG RELEASE PATTERNS OF CONTROLLED DELIVERY DOSAGE FORMS
If one assumes that —
1.
Drug disposition follows
first-order kinetics
2.
Rate-limiting step in the
absorption is rate of drug release from the controlled-release formulation
(i.e. Kr < Ka), and
3.
Released drug is rapidly and
completely absorbed,
then, the four models for drug input based on the
drug release pattern can be defined:
1. Slow zero-order release
2. Slow first-order release
3. Initial rapid release of
loading dose followed by slow zero-order release
4. Initial rapid release of loading dose followed
by slow first-order release.
The resulting profiles are depicted in Fig. 14.3.

Fig. 14.3 Schematic representation of four
major types of drug release characteristics from controlled-release
formulations
1. Slow Zero-Order Release Systems
If the drug released from controlled-release
formulations is stable in fluids at the absorption site, has similar absorption
efficiency from all absorption sites and is absorbed rapidly and completely
after its release, then, its rate of appearance in plasma will be governed by
its rate of release from the controlled-release formulation. Thus, when the
drug release follows zero-order kinetics, absorption will also be a zero-order
process and concentration of drug in plasma at any given time can be given by
equation:

where K0
= zero-order release rate constant, also written as R0, the
zero-order release rate.
The above equation is similar to the one that
expresses the concentration-time course of a drug that shows one-compartment
kinetics following constant rate i.v. infusion. The time to reach steady-state
depends upon the elimination half-life of the drug. It is usually not possible
with a single oral controlled-release dose to attain the plateau even with a
drug having short half-life such as 3 hours since the mean GI residence time is
around 12 hours. It takes 4.3 half-lives for attainment of 95% steady-state
values. Thus, if t½ is 3 hours, about 13 hours will be required for
the drug to reach plateau. Slower the elimination, (longer the t½),
more the time required to reach steady-state. Once the desired steady-state is
reached with repeated dosing of zero-order controlled-release formulation,
minimal fluctuations will be observed. Zero-order
release systems are thus ideal
controlled delivery formulations.
2. Slow First-Order Release Systems
Such systems are easier to design but are inferior
to zero-order systems especially when they are meant for oral use. This is
because with first-order release characteristics, smaller and smaller amounts
of drug are released as time passes and secondly, as the formulation advances
along the GIT, the absorption efficiency generally decreases due to a number of
reasons like decreased intestinal surface area, increased viscosity and
decreased mixing. Thus, larger amounts of drug are needed to be released at a
later stage when in fact the opposite happens with first-order systems.
The concentration of drug in plasma following
administration of a controlled-release formulation with slow first-order
release is given by equation:

When Kr < KE, flip-flop
phenomena is observed which is a common feature for such controlled-release
formulations. With repeated dosing of slow first-order release formulations,
one generally observes a lower Cmax, higher Cmin and
longer tmax in comparison to conventional release formulations.
3. Slow Zero-Order Release Systems with a Rapid Release Component
With such formulations, an initial dose is rapidly
released (burst-effect) for
immediate first-order availability while the remaining amount is released and
absorbed at a slow zero-order rate. The equation for concentration-time course
of such a formulation contains two portions, one each to denote rapid
first-order release and slow zero-order release.

Such a formulation is ideally suited for drugs with
long t½ in which cases attainment of plateau would otherwise take a
long time. The slow release component should ideally begin releasing the drug
when the drug levels from the fast component are at a peak. However, the
approach suffers from a big disadvantage when the formulation is meant for
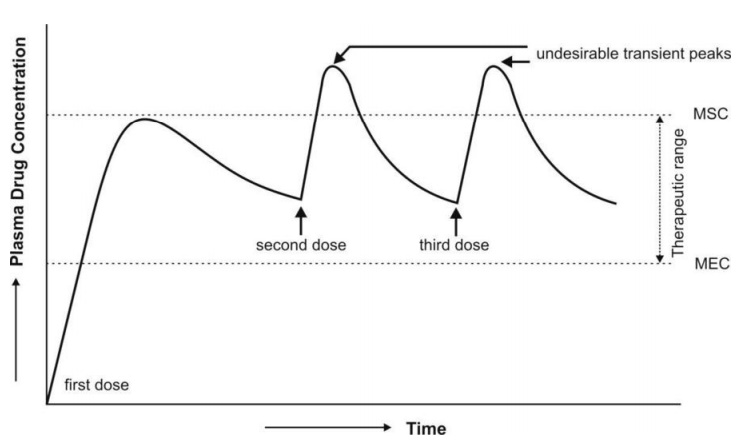
repetitive dosing — the blood level profile shows a peak-trough pattern (which
normally does not result when all of the drug is released at a slow zero-order
rate); this may cause a momentous rise in peak concentration immediately after
each dose triggering toxic reactions (see
Fig. 14.4). It is for this reason that such a design is unpopular.
The transient fluctuations in the peak
concentration with these formulations can however be overcome by:
1. Decreasing the loading dose in
the subsequent dosage forms (which appears to be impractical),
2. Increasing the dosing interval
(this also seems to be tedious), or
3. Administering an immediate-release conventional
dosage form prior to repetitive dosing of zero-order controlled-release
formulation instead of incorporating it in the latter.

Fig. 14.4 Plasma concentration-time profile which results from repeated dosing of
a controlled-release formulation
with zero-order release and an initial fast release component.
4. Slow First-Order Release Systems with a Rapid Release Component
The equation describing the time course of plasma
drug concentration with this type of formulation will also contain two
portions—one to describe rapid first-order absorption and the other for slow
first-order absorption from controlled-release portion.

As in the previous case, to obtain the desired
plateau, the slow release component, DM should start releasing the
drug:
1. When the peak has been
attained with rapid release dose, DI; this requires DM
>> DI which results in wastage of drug since the absorption
efficiency reduces as time passes and dosage form descends down the GIT, or
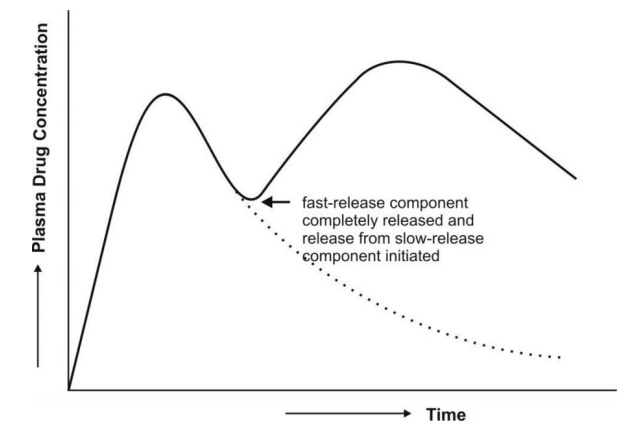
2. When all of the DI
has been released; this requires relatively small DM and therefore
less drug wastage and better sustained levels despite fluctuations in drug
levels (Fig. 14.5).
The problems that result from repeated dosing of
this type of formulation are similar to that described for the third type of
release pattern and can be handled in a similar manner.

Fig. 14.5 Plasma concentration-time profile
which results after a single oral dose of
controlled-release drug delivery system containing a rapid release dose and
a slow first-order release component
Related Topics

