McNemar’s Test for Correlated Proportions
| Home | | Advanced Mathematics |Chapter: Biostatistics for the Health Sciences: Categorical Data and Chi-Square Tests
We used the paired t test to examine correlated interval and ratio measurements.
McNEMAR’S TEST FOR CORRELATED PROPORTIONS
In Chapter 9, we discussed the concept of paired
observations. An illustration was the paired t test, which is used when two or more measurements are correlated.
That is, we might conduct an experiment and collect before and after
measurements on each subject. The subject’s score on the after measure is in
part a function of the status on the before measurement. Other examples in
which paired observations occur include studies of twins (who have genetically
similar characteristics) and animal experiments that use littermates.
We used the paired t test to examine correlated interval and ratio measurements.
McNemar’s test is used for categorical data that are correlated, for assessment
of equality of proportions when the binary categorical measurements are
correlated. When the binary measurements cannot be made on the same subjects,
as in the fol-lowing example, we can still use McNemar’s test to advantage if
there is a way to pair the subjects so that the results are correlated.
Correlation will be discussed in detail in Chapter 12. This can happen, for
example, in a case control study where demographic characteristics are used to
match subjects.
Here is an example: Suppose that we would like to
find out how people stop smoking successfully. In particular, we would like to
determine which of two meth-ods is more effective: the nicotine patch or group
counseling sessions. So we match 150 subjects who tried to stop by using the
nicotine patch with 150 subjects who tried to stop smoking by using group
counseling.
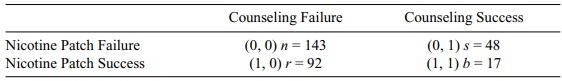
Then we proceed as follows. Define 0 as a failure and 1 as a success. The possi-ble pairs are (0, 0), (0, 1), (1, 0), and (1, 1) with the first coordinate representing the nicotine patch subject and the second representing the matched subject who tried group counseling. Let r be the number of cases with (1, 0) (i.e., the first member of the pair being successful on the nicotine patch with the corresponding member of the pair a failure using group counseling) and s the number of cases with (0, 1) (i.e., subjects who fail using the nicotine patch but whose corresponding member of the pair is successful under group counseling). These are called nonconcordant pairs because the subjects in the pair have opposing outcomes. The other pairs (0, 0) (both members of the pair fail) and (1, 1) (both members of the pair succeed) are called concordant pairs because the results are the same for the members of the pair. These are also sometimes called tied pairs because the scores are the same for each member of the pair.
TABLE 11.9. Outcomes for Pairs of Subjects that Attempted to Stop Smoking
The concordant observations provide information about the degree of positive correlation between the members of the pair but do
not provide any information about whether or not the two proportions are equal.
If we consider only the tables that have the observed values for r + s,
the nonconcordant pairs provide all the in-formation we need to test the null
hypothesis that the two proportions are equal. This is similar to conditioning
on the marginal totals as we did for Fisher’s exact test in the 2 × 2
contingency table that you will encounter in Chapter 14.
Under the null hypothesis, we expect r and s to be about the same. So the expect-ed total for (1, 0) pairs is
(r + s)/2 and the expected total for
(0, 1) is also (r + s)/2 under the
null hypothesis. We use a chi-square statistic that compares the observed
totals r and s to their expected values ([r
+ s]/2 under the null hypothesis). In Mc-Nemar’s test, we ignore the number
of concordant pairs n + b, where n is the num-ber of (0, 0) pairs and b is the number of (1, 1) pairs. McNemar’s test statistic is T = (r
– [r + s]/2)2/[r + s]/2 + (s – [r + s]/2)2/[r + s]/2. This simplifies to (r – s)2/(r + s) since (r – [r + s]/2)2/[r + s]/2 = ([r – s]/2)2/[r + s]/2
= (r – s)2/[2(r + s)] and (s – [r + s]/2)2/[r + s]/2 = ([s – r]/2)2/[r + s]/2
= (r – s)2/[2(r + s)] also [see Conover (1999), page 166, for more details on
McNemar’s test]. The data are shown in Table 11.9. There are 300 matched pairs
of subjects. 109 nicotine users were successful (r + b) and 66 counseling
users (s + b) were successful. T = (r – s)2/(r + s) = (44)2/140 = 1936/140 = 13.8 (significant, p < 0.01, df = 1). Note that n and b are ignored since they do not
contribute to determining the difference.
We conclude that the nicotine patch is more
commonly used than group counseling among persons who stop smoking. Or put
another way, subjects who try to stop smoking are more successful if they use
the nicotine patch rather than group counseling.
Related Topics
