Concentration-Response Relationships - Pharmacodynamic Models
| Home | | Biopharmaceutics and Pharmacokinetics |Chapter: Biopharmaceutics and Pharmacokinetics : Drug Concentration and Pharmacological Response
With most drugs, the response produced is reversible i.e. a reduction in concentration at the site of action reverses the effect.
Concentration-Response Relationships – Pharmacodynamic Models
With most drugs, the response produced is reversible i.e. a reduction in concentration at the site of action reverses the effect. The response produced by a drug can be classified into two categories –
1. Graded response - is the one where intensity of effect increases with the dose or concentration of drug. A majority of drugs produce graded response. The response can be measured on a continual basis in such cases and establishing a linear relationship between drug concentration and intensity of response is easy.
2. Quantal Response – is the one where the drugs may either show their effect or not at all i.e. the responses are not observed on a continuous basis, for example, prevention of seizures by phenytoin. Such responses are also called as all-or-none responses. Thus, establishing a concentration-response relationship in such circumstances is difficult but can be developed in terms of the frequency with which a particular event occurs at a given drug concentration.
Mathematical models that relate pharmacological effect to a measured drug concentration in plasma or at the effector site can be used to develop quantitative relationships. Such models are often called as pharmacodynamic models. Some of the commonly used relationships or models are discussed below.
1. Linear Model: When the pharmacological effect (E) is directly proportional to the drug concentration (C), the relationship may be written as:
E = PC + E0 (13.1)
where P is the slope of the line obtained from a plot of E versus C and Eo is the extrapolated y-intercept called as baseline effect in the absence of drug.
2. Non-linear/Logarithmic Model: If the concentration-effect relationship does not conform to a simple linear function, a logarithmic transformation of the data is needed.
E = PlogC + 1 (13.2)
where I is empirical constant. This transformation is popular because it expands the initial part of the curve where response is changing markedly with a small change in concentration and contracts the latter part where a large change in concentration produces only a slight change in response. An important feature of this transformation is the linear relationships between drug concentration and response at concentrations producing effects of between 20 to 80% of the maximum effect (Fig. 13.1). Beyond this range, a larger dose produces a larger concentration of drug in the body.
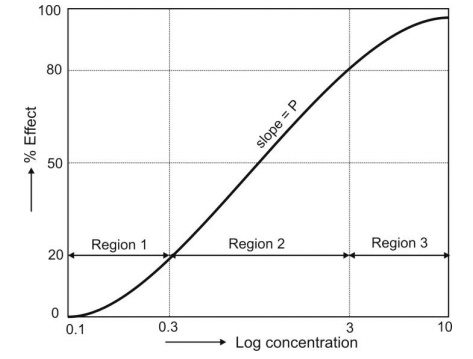
Fig. 13.1 A typical sigmoidal shape log drug concentration-effect relationship
3. Emax Model/Hyperbolic Model: Unlike earlier models, these models describe non-linear concentration-effect relationships i.e. the response increases with an increase in drug concentration at low concentrations and tends to approach
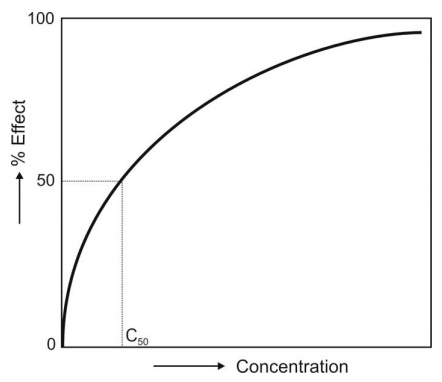
Fig. 13.2 A hyperbolic concentration-response relationship based on Emax model
maximum (asymptote) at high concentrations (Fig. 13.2). Such a plot is characteristic of most concentration-response curves. None of the preceding models can account for the maximal drug effect as the Emax models.
Michaelis-Menten equation for a saturable process (saturation of receptor sites by the drug molecules) is used to describe such a model.
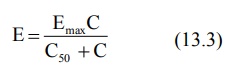
where
Emax = maximum effect, and
C50 = the concentration at which 50% of the effect is produced.
When C << C50, the equation reduces to a linear relationship. In the range 20 to 80%, the Emax model approximates equation 13.2.
4. Hill Model/Sigmoid-Emax Model: In certain cases, the concentration-response relationship is steeper or shallower than that predicted from equation 13.3. A better fit may otherwise be obtained by considering the shape factor ‘h’, also called as Hill coefficient, to account for deviations from a perfect hyperbola, and the equation so obtained is called Hill equation (equation 13.4).
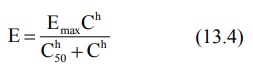
If h = 1, a normal hyperbolic plot is obtained and the model is called Emax model. Larger the value of h, steeper the linear portion of the curve and greater its slope. Such a plot is often sigmoidal and thus, the Hill model may also be called as sigmoid-Emax model (Fig. 13.3).
Fig. 13.3 Effect of shape factor n on the concentration-response curves
Related Topics