Free Energy Change
| Home | | Biochemistry |Chapter: Biochemistry : Bioenergetics and Oxidative Phosphorylation
The change in free energy is represented in two ways, ∆G and ∆Go. The first, ∆G (without the superscript “o”), represents the change in free energy and, thus, the direction of a reaction at any specified concentration of products and reactants.
FREE ENERGY CHANGE
The change in free
energy is represented in two ways, ∆G and ∆Go. The first, ∆G (without the
superscript “o”), represents the change in free energy and, thus, the direction
of a reaction at any specified concentration of products and reactants. DG,
then, is a variable. This contrasts with the standard free energy change, ∆Go
(with the superscript “o”), which is the energy change when reactants and
products are at a concentration of 1 mol/l. [Note: The concentration of protons
is assumed to be 10–7 mol/l (that is, pH = 7). This may be shown by a prime
sign (I), for example, ΔGoI.] Although ∆Go, a constant,
represents energy changes at these nonphysiologic concentrations of reactants
and products, it is nonetheless useful in comparing the energy changes of
different reactions. Furthermore, ∆Go can readily be determined from
measurement of the equilibrium constant. This section outlines the uses of ∆G,
and ∆Go is described on later section.
A. Sign of ∆G and the direction of a reaction
∆G can be used to
predict the direction of a reaction at constant temperature and pressure.
Consider the reaction:
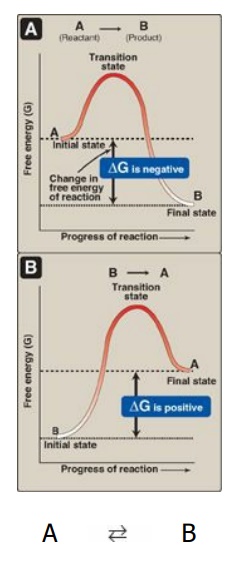
Figure 6.2 Change in free energy (ΔG) during a reaction. A The product has a lower free energy (G) than the reactant. B The product has a higher free energy than the reactant.
A ↔ B
1. Negative ∆G: If ∆G is negative, there is a net loss of energy,
and the reaction goes spontaneously as written (that is, A is converted into B)
as shown in Figure 6.2A. The reaction is said to be exergonic.
2. Positive
∆G: If ∆G
is positive, there is a net gain of energy, and the reaction does not go
spontaneously from B to A (see Figure 6.2B). Energy must be added to the system
to make the reaction go from B to A. The reaction is said to be endergonic.
3. ∆G is zero: If ∆G = 0, the reactants are in equilibrium. [Note:
When a reaction is proceeding spontaneously (that is, free energy is being
lost) then the reaction continues until ∆G reaches zero and equilibrium is
established.]
B. ∆G of the forward and back reactions
The free energy of the
forward reaction (A → B) is equal in magnitude but opposite in sign to that of
the back reaction (B → A). For example, if ∆G of the forward reaction is −5
kcal/mol, then that of the back reaction is +5 kcal/mol. [Note: ∆G can also be
expressed in kilojoules per mole or kJ/mol (1 kcal = 4.2 kJ).]
C. ∆G and the concentration of reactants and products
The ∆G of the reaction
A → B depends on the concentration of the reactant and product. At constant
temperature and pressure, the following relationship can be derived:
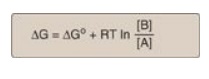
where
where
∆Go is the
standard free energy change (see below)
R is the gas constant
(1.987 cal/mol K)
T is the absolute
temperature (K)
[A] and [B] are the
actual concentrations of the reactant and product
In represents the
natural logarithm
A reaction with a
positive ∆Go can proceed in the forward direction (have a negative overall ∆G)
if the ratio of products to reactants ([B]/[A]) is sufficiently small (that is,
the ratio of reactants to products is large). For example, consider the
reaction:
Glucose 6-phosphate ↔ fructose 6-phosphate
Figure 6.3A shows reaction
conditions in which the concentration of reactant, glucose 6-phosphate, is high
compared with the concentration of product, fructose 6-phosphate. This means
that the ratio of the product to reactant is small, and RT ln([fructose
6-phosphate]/[glucose 6-phosphate]) is large and negative, causing ∆G to be negative
despite ∆Go being positive. Thus, the reaction can proceed in the forward
direction.
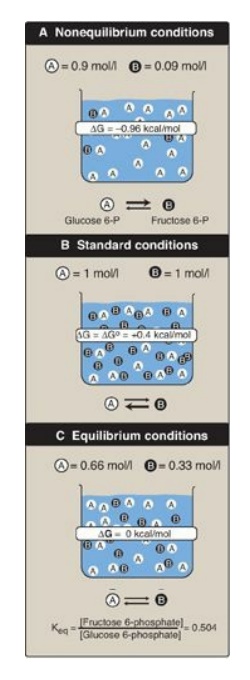
Figure 6.3 Free energy change
( ![]() ) of a reaction depends on the concentration of reactant and product
) of a reaction depends on the concentration of reactant and product ![]() . For the conversion of glucose
6-phosphate to fructose 6-phosphate, ΔG is negative when the ratio of reactant
. For the conversion of glucose
6-phosphate to fructose 6-phosphate, ΔG is negative when the ratio of reactant ![]() to product
to product ![]() is large
(top, panel A), is positive under standard conditions (middle, panel B), and is
zero at equilibrium (bottom, panel C). ΔG0 = standard free energy change.
is large
(top, panel A), is positive under standard conditions (middle, panel B), and is
zero at equilibrium (bottom, panel C). ΔG0 = standard free energy change.
D. Standard free energy change
Τhe standard free
energy change, ∆Go, is so called because it is equal to the free
energy change, ∆G, under standard conditions (that is, when reactants and
products are at 1 mol/l concentrations; see Figure 6.3B). Under these
conditions, the natural logarithm of the ratio of products to reactants is zero
(ln1 = 0), and, therefore, the equation shown at the bottom of the previous
page becomes:
∆G = ∆Go + 0
1. ∆Go and the direction of a reaction: Under standard conditions, ∆Go
can be used to predict the direction a reaction proceeds because, under these
conditions, ∆Go is equal to ∆G. However, ∆Go cannot
predict the direction of a reaction under physiologic conditions, because it is
composed solely of constants (R, T, and Keq [see below]) and is not, therefore,
altered by changes in product or substrate concentrations.
2. Relationship between ∆Go and Keq: In a reaction A ↔ B, a
point of equilibrium is reached at which no further net chemical change takes
place (that is, when A is being converted to B as fast as B is being converted
to A). In this state, the ratio of [B] to [A] is constant, regardless of the
actual concentrations of the two compounds:
Keq = [B]eq / [A]eq
where Keq is the
equilibrium constant, and [A]eq and [B]eq are the
concentrations of A and B at equilibrium. If the reaction A ↔ B is
allowed to go to equilibrium at constant temperature and pressure, then, at
equilibrium, the overall ∆G is zero. Therefore,
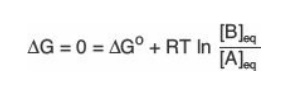
where the actual
concentrations of A and B are equal to the equilibrium concentrations of
reactant and product [A]eq and [B]eq, and their ratio is
equal to the Keq. Thus,
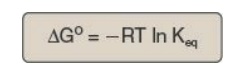
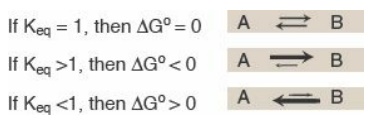
This equation allows
some simple predictions:
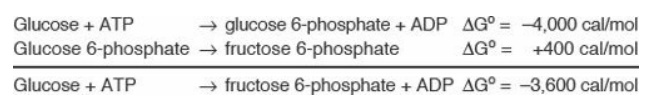
3. ∆Go of two consecutive reactions: The ∆Gos are additive in
any sequence of consecutive reactions, as are the ∆Gs. For example:
4. ∆Gs of a pathway: The additive property of free
energy changes is very important in biochemical pathways through which
substrates must pass in a particular direction (for example, A → B → C → D →…).
As long as the sum of the ∆Gs of the individual reactions is negative, the
pathway can potentially proceed as written, even if some of the individual
reactions of the pathway have a positive ∆G. The actual rate of the reactions
does, of course, depend on the lowering of activation energies by the enzymes
that catalyze the reactions.
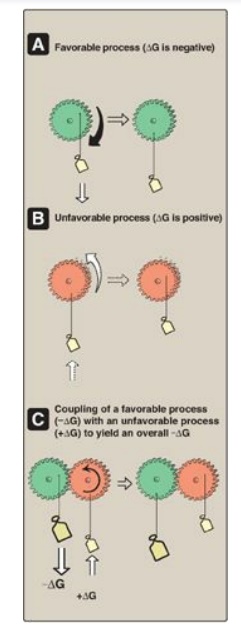
Figure 6.4 Mechanical model
of coupling of favorable and unfavorable processes.A
Gear with weight attached spontaneously turns in the direction that achieves
the lowest energy state. B The reverse
movement is energetically unfavorable (not spontaneous). C
The energetically favorable movement can drive the unfavorable one.
Related Topics
