Kinetics of Protein-Drug Binding
| Home | | Biopharmaceutics and Pharmacokinetics |Chapter: Biopharmaceutics and Pharmacokinetics : Protein Binding of Drugs
If P represents proteins and D the drug, then applying law of mass action to reversible protein-drug binding.
KINETICS OF PROTEIN-DRUG BINDING
If P represents proteins and D the drug, then applying law of mass action to reversible protein-drug binding, we can write:
P + D ======== PD (4.11)
At equilibrium,

where, [P] = concentration of free protein
[D] = concentration of free drug
[PD] = concentration of protein-drug complex
Ka = association rate constant
Kd = dissociation rate constant
Ka > Kd indicates forward reaction i.e. protein-drug binding is favoured. If PT is the total concentration of protein present, bound and unbound, then:

If r is the number of moles of drug bound to total moles of protein, then,

Substituting the value of [PD] from equation 4.13 in equation 4.15 we get:

Equation 4.16 holds when there is only one binding site on the protein and the protein-drug complex is a 1:1 complex. If more than one or N number of binding sites are available per mole of the protein then:

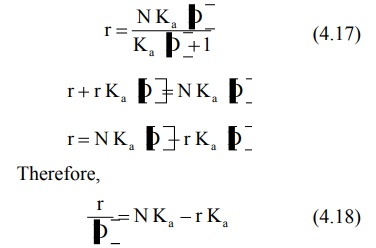
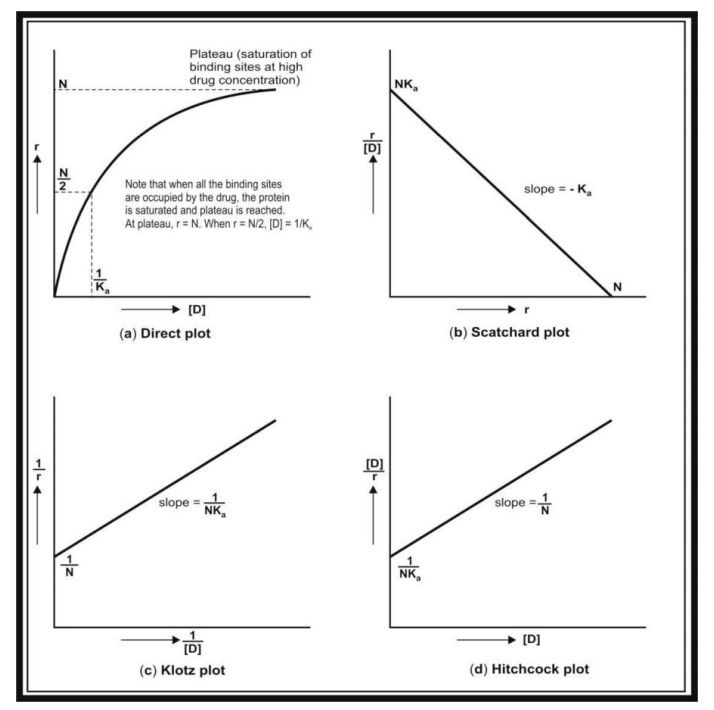
The value of association constant, Ka and the number of binding sites N can be obtained by plotting equation 4.17 in four different ways as shown below (see Fig. 4.4.).
1. Direct Plot is made by plotting r versus [D] as shown in Fig. 4.4a. Note that when all the binding sites are occupied by the drug, the protein is saturated and plateau is reached. At the plateau, r = N. When r = N/2, [D] = 1/Ka.
2. Scatchard Plot is made by transforming equation 4.17 into a linear form. Thus,

A plot of r/[D] versus r yields a straight line (Fig. 4.4b). Slope of the line = – Ka, y-intercept = NKa and x-intercept = N.
3. Klotz Plot/Lineweaver-Burke Plot (Double Reciprocal Plot): The reciprocal of equation 4.17 yields:

A plot of 1/r versus 1/[D] yields a straight line with slope 1/NKa and y-intercept 1/N (Fig. 4.4c).
4. Hitchcock Plot is made by rewriting equation 4.19 as –

Dividing both sides by NKa gives –

Equation 4.21 is Hitchcock equation according to which a plot of [D]/r versus [D] yields a straight line with slope 1/N and y-intercept 1/ NKa (see Fig. 4.4d).

Fig. 4.4. Plots used for the study of protein-drug binding. (a) Direct plot; (b) Scatchard plot; (c) Klotz plot; and (d) Hitchcock plot.
Related Topics
